What is Forecasting?
Forecasting is a technique to establish relationships and trends which can be projected into the future, based on historical data and certain assumptions. This method can be utilized to better understand and make an educated guess on how to adjust budgets, anticipate future expenses or sales, or other similar decisions. A disclaimer here: Forecasting doesn’t tell you the future or gives you a definitive way to proceed with a decision - it only shows you probabilities and what might be the best course of action. You should always double check your results before deciding.
Why use Excel?
Excel offers many tools for forecasting and has the ability to store, calculate, and visualize data. Even if you don’t keep your data in Excel, you can import files or connect to external databases to use its built-in tools and formulas for forecasting. The visualization of the data is a simple process thanks to Excel Charts and formatting features.
Forecasting Methods and Forecasting in Excel
There are several of forecasting methods for forecasting in Excel, and each rely on various techniques. Obviously, none will give you definitive answers without the ability to see the future. These results are best used to make educated guesses. In our article, we focus on 3 commonly used quantitative methods that can be easily used in Excel.
- Moving Averages
- Exponential Smoothing (ETS)
- Linear Regression
You can download our sample workbook below.
Moving Averages
Moving averages is a method used to smooth out the trend in data (i.e. time series). The idea is to filter out the micro deviations in a sample time range, to see the longer-term trend that might affect future results.
The simplest form of a moving average is calculated by taking the arithmetic mean of a given set of values. For example, let’s assume that you want to smooth out the daily changes of sales in a week. To calculate the weekly moving average, we must first find the average of 7 days, starting from the first day. Next, calculate the average of 7 days from day 2nd to day 8th and use this data. To do this, you can use the AVERAGE function with relative references.
=AVERAGE(B5:B11) formula in our example calculates the average of values between the 4th and 10th days.

For more information about finding the mean of a data set, please see How to calculate mean in Excel.
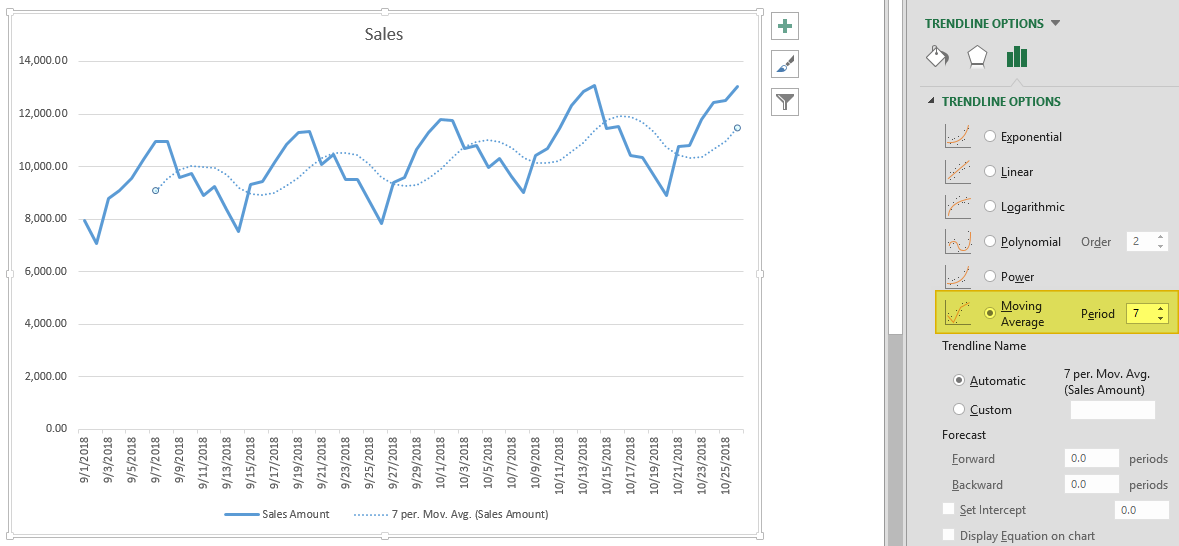
There is an alternative way to add moving averages that also inserts the data into a chart. Start by creating a chart with the past data. You will see a plus icon to the right of the chart. You can add or remove elements from this menu.

Click on the plus icon and move your mouse over the Trendline item. Click the right arrow and select the More Options… item from the dropdown menu. TRENDLINE OPTIONS panel will pop up at the right side of the Excel window.

Select Moving Average and set the Period based on your data. You will see the same moving average line on your chart.
Exponential Smoothing (ETS)
Another method for forecasting in Excel is Exponential Smoothing. Exponential Smoothing, like Moving Averages, is based on smoothing past data trends. However, this algorithm performs smoothing by detecting seasonality patterns and confidence intervals. This feature is available in Excel 2016 or later. You can use your own formulas, or have Excel automatically do this with its Forecast Sheet feature. Excel's Forecast Sheet feature automatically adds formulas and creates a chart in a new sheet. Follow the steps below to use this feature.
- Select the data that contains timeline series and values.
- Go to Data > Forecast > Forecast Sheet
- Choose a chart type (we recommend using a line or column chart).
- Pick an end date for forecasting.
- Click the Create

Your actual data will be moved into a new sheet with the addition of a few columns, and the chart of your selection that matches what you’ve seen in the preview will be placed on this page.

These 3 new columns are for the forecast and boundary values for the confidence interval. The confidence interval is the range where future points are expected to fall. For example, 95% means that 95% percent of the future values will be in the specified range. The range is calculated using normal distribution.
If you click on the values in the new columns, you can see the formulas being used. The FORECAST.ETS function is used to find the forecast values and the FORECAST.ETS.CONFINT function returns the interval value. Arguments of the formulas are populated based on the inputs in Options section.
Customizing
Advanced options can be found under the Options section in the Create Forecast Sheet dialog. Click the Options label to go to this menu.
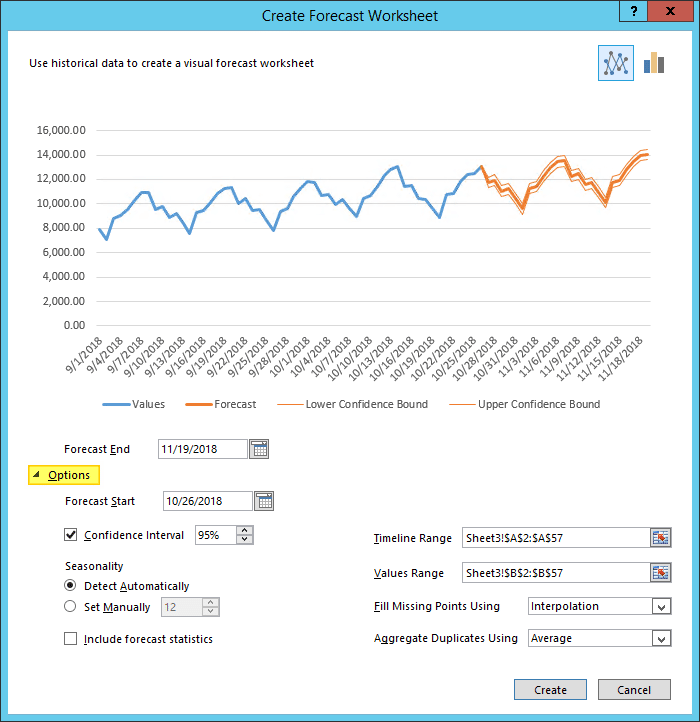
| Forecast Start | The timeline value where the forecast starts. If your timeline values are dates, you can select a date from the date picker.
Excel can automatically detect where your data ends and pick the next timeline value. Alternatively, previous timeline points can be selected to see how the forecasting algorithm works. |
| Confidence Interval | Check or uncheck the input to show or hide the Confidence Interval calculations. The default level of confidence is 95%. |
| Seasonality | The length of the seasonal pattern. Excel can automatically detect this pattern. Alternatively, you can change the value to better fit your needs. |
| Timeline Range | Reference that contains the timeline values. This range needs to match the Values Range. |
| Values Range | Reference that contains the actual values. This range needs to match the Timeline Range. |
| Fill Missing Points Using | Excel can fill in the missing points based on the weighted average of neighboring points. This approach is called Interpolation. Alternatively, Zeroes can be selected to show the missing points as zeroes. |
| Duplicate Aggregates Using | An option for how Excel behaves when there are multiple values with the same timeline value. Calculating the average is the default option. |
| Include Forecast Statistics | If you are familiar with statistics, check this input to display smoothing coefficients (Alpha, Beta, Gamma), and error metrics (MASE, SMAPE, MAE, RMSE).
These values are calculated by the FORECAST.ETS.STAT function. |
Linear Regression
Forecasting in Excel can be done using various formulas. One of the most commonly used formulas is the FORECAST.LINEAR for Excel 2016, and FORECAST for earlier versions. Although Excel still supports the FORECAST function, if you have 2016 or later, we recommend updating your formulas to prevent any issues in case of a function deprecation. If you do not have Excel 2016 or newer, you should use the FORECAST function. We will continue to refer the function as FORECAST in the rest of this article.
Unlike the ETS algorithm, the FORECAST function predicts future values using linear regression. Linear regression determines the linear relation between timeline series and values series. This linear approach makes it unsuitable for data with seasonality or other cycles, as well as non-linearity. On the other hand, linear regression is useful for causal models due to its simplicity.
Since Excel doesn't have a wizard for the traditional FORECAST function, you will need to do some of the required steps manually.
- Add new timeline points to your data table for the values to use in the forecast. For example, from 10/27 to 11/19.
- Select the cell where the first forecast value is to be calculated. (e.g. C58)
- Start a formula with the FORECAST function by these arguments:
- Select the first timeline value to use in forecast. Leave the reference as relative. (e.g. A58)
- Select the range that contains the actual values. Make the range absolute. (e.g. $B$2:$B$57)
- Select the range that contains the timeline values. Make the range absolute. (e.g. $A$2:$A$57)
- Copy the formula down for the rest of the column.
Sample formula for the first forecast point: =FORECAST.LINEAR(A58,$B$2:$B$57,$A$2:$A$57)

