Creating interactive web applications often means turning data into something visually understandable and engaging. If you're using SpreadsheetWeb to build your web app, you might find yourself wanting to add graphical elements like 2-D shapes that respond to your data in real-time. This is where integrating an external drawing library, such as Two.js (you can check this link), becomes valuable. In this detailed guide, we're going to explore how to seamlessly blend Two.js with SpreadsheetWeb, allowing you to draw 2-D objects that adapt to your data and the viewer's screen size.
Why Two.js 'Drawing Library' with SpreadsheetWeb?
SpreadsheetWeb can turn your Excel spreadsheets into web applications, handling data manipulation and calculations effortlessly. However, when it comes to visualizing this data through dynamic drawings or complex animations, you might need a helping hand. That's where Two.js comes into the picture. It's a flexible and straightforward JavaScript library that helps you draw in two dimensions across different web browsers, without needing to dive deep into the complexities of <canvas>, WebGL, or SVG directly.
Prerequisites
Before diving into the drawing implementation, ensure you have a SpreadsheetWeb account and basic familiarity with JavaScript and jQuery. Knowledge of HTML and CSS will also be beneficial for customizing your charts.
Before We Start
To begin, either establish a new application or choose one that's already in SpreadsheetWeb. Then, proceed to the script panel, where you have the ability to inject custom JavaScript code to enhance the capabilities of your application. However, be aware that the option to add scripts is limited to specific subscription tiers. Make sure that your subscription plan includes support for scripting functionalities.

Setting the Stage
Imagine you're working on a web application that visualizes data dynamically. For example, it could be displaying or drawing floor plans, plotting geographical data, or simply turning abstract data into visually appealing shapes. To achieve this, we'll integrate Two.js drawing library with SpreadsheetWeb. Here's how:
Step 1: Calculating the Scale Factor for Drawing
First, we need to figure out how big or small to make our shape so it fits nicely on the screen. The ‘calculateScaleFactor’ function does exactly this by comparing the shape's size to the available space.
function calculateScaleFactor(gridValues, maxWidth, maxHeight, baseScaleFactor) {

    var minX = Infinity, maxX = -Infinity, minY = Infinity, maxY = -Infinity;

    ...

    var scaleFactor = Math.min(scaleX, scaleY, baseScaleFactor);

    return scaleFactor;

}
- It looks at all the points (gridValues) that make up our shape to find the furthest points in each direction (minX, maxX, minY, maxY), which tells us the size of our shape.
- Then, it figures out how much we can increase (scaleX for width, scaleY for height) our shape size to fit the screen (maxWidth, maxHeight) without stretching it weirdly. We also consider a baseScaleFactor to not make the shape too big or too small from what we initially want.
- Finally, we pick the smallest scale factor (to make sure our shape fits in both width and height) and use that to adjust our shape size.
Step 2: Adjusting Canvas and Scale
Before start to use drawing library, we make sure our drawing area (canvas) fits perfectly where we want to draw, and we use the scale factor we just calculated to adjust our shape size correctly.
function adjustCanvasAndScale(two, gridValues, baseScaleFactor) {

    ...

    var scaleFactor = calculateScaleFactor(gridValues, maxWidth, maxHeight, baseScaleFactor);

    ...

    return scaleFactor;

}
- We figure out how big our drawing area should be by checking the size of the area we're allowed to draw in (‘container’).
- Then, we call our ‘calculateScaleFactor’ function to see how much we need to adjust our shape size based on this new space.
- We update the drawing area size (‘two.width, two.height’) to match the space we have.
- The function ends by giving us the scale factor, telling us how much to adjust our shape when we draw it.
Step 3: Updating the Drawing
This is where the drawing happens! We use all our calculations to actually draw our shape on the screen by using this drawing library.
function updateDrawing(two, gridValues, baseScaleFactor) {

    ...

    var points = gridValues.map(function(row) {

        ...

    });

    ...

}
- We first clear any old drawings (two.clear()).
- We adjust our canvas size and get our scale factor using adjustCanvasAndScale.
- We figure out the center of our shape and the center of our drawing area to make sure we draw our shape in the middle of the screen.
- We adjust each point of our shape (gridValues) based on our scale factor and the centering we calculated. This might involve moving points around so that when we draw our shape, it's scaled correctly and positioned nicely in the middle.
- Then, we draw our shape using these adjusted points. We set some visual styles (like the color and thickness of the line) and tell Two.js to update the screen with our new drawing.
Step 4: Initialization and Event Listeners
Finally, we set everything up so it runs at the right time and responds to changes, like the screen size changing.
$.getScript("https://cdnjs.cloudflare.com/ajax/libs/two.js/0.8.12/two.min.js", function() {

    ...

    window.addEventListener('resize', function() {

        updateDrawing(two, initialGridValues, baseScaleFactor);

    });

}).fail(function(jqxhr, settings, exception) {

    console.error("Failed to load Two.js library:", exception);

});
- We start by loading the Two.js drawing library. Once it's loaded, we set up our drawing area and initial shape.
- If the library doesn't load, we show an error message.
- We make sure our shape drawing updates whenever the shape's data changes (outputGrid1.on("change"...)) or the browser window size changes (window.addEventListener('resize'...)). This keeps our shape looking right no matter what.
Let's look at this through an example.
Example Scenario for Drawing with Two.js
Imagine you're playing with building blocks. You have a set of different blocks that you can arrange in any form. Now, let's translate this into a digital environment. Instead of physical blocks, you have data points that you want to turn into a shape on your screen. But as with building blocks, you need a system to make sure that your digital shape looks just right, no matter where you place it. That's what this code does, but it's even cooler because it can change the shape dynamically if you decide to swap some blocks around or stretch them out.
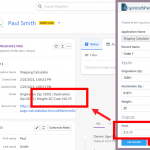
How the Code Interacts with the Images
You've shown us a glimpse of a very interactive setup:
- The Coordinate System: This is like a map of where each point of your shape will be placed. Changing your input values will change these coordinate points so will change the shape.

- The Control Panel: Think of this as your toolbox. You can change the values here, like adjusting the size of the blocks or how far apart they are, and the map from the first image updates with these new values.

- The Drawing: This is the final outcome. It's your digital structure built from the data points, displayed beautifully on your screen.


Let's walk through how the code handles this interaction, in plain language, with lots of details to make it easy to understand.
Deep Dive into the Code
Preparing the Canvas
Before we start to use this drawing library Two.js, we need a clean slate, which is our canvas. We need to make sure it's the right size so that no matter how you adjust the blocks (or in our digital case, the shape), it still fits nicely on your screen.
Here's the equivalent of rolling out a sheet of paper that's just the right size:
var container = $(two.renderer.domElement).parent();

var maxWidth = container.width();

var maxHeight = container.height();

two.width = maxWidth;

two.height = maxHeight;

two.renderer.setSize(maxWidth, maxHeight);
Getting the Measurements Right
We want our shape to look good, not stretched or squished. This is where we get our ruler out and start measuring. The measurements come from the map of data points you gave us (the first image), and we use a smart rule (the calculateScaleFactor function) that tells us how big or small we should make our shape based on the size of the paper we just rolled out.
This code is like a conversation with the points on the map, asking them how much space they need:
var scaleFactor = calculateScaleFactor(gridValues, maxWidth, maxHeight, baseScaleFactor);
Responding to Changes
Now, you're playing with your blocks, and you decide to change their size using the toolbox (the second image). The moment you do that, our system notices and tells the map (the first image) to update the points. Then, it quickly erases the old shape and draws a new one that matches your new design.
Imagine a sketch artist redrawing your portrait every time you change your pose:
outputGrid1.on("change", function() {

    var newGridValues = outputGrid1.value().slice(2);

    updateDrawing(two, newGridValues, baseScaleFactor);

});
Center Stage
When we're drawing the shape, we don't just start scribbling anywhere. We first find the middle of the paper, then we find the middle of our shape on the map. We use this info to place our shape right in the center of the paper.
var canvasCenterX = two.width / 2;

var canvasCenterY = two.height / 2;
The Transformation
Now comes the part where we turn our data points into a visible shape. We take each point from the updated map and use our ruler's advice (the scale factor) to place them precisely on the paper. We connect these dots to reveal your digital structure, just like connecting dots in a children's activity book.
Here's how we carefully place each point:
var points = gridValues.map(function(row) {

    var x = (parseFloat(row[0]) - shapeCenterX) * scaleFactor + canvasCenterX;

    var y = (maxY - (parseFloat(row[1]) - minY)) * scaleFactor + canvasCenterY - (maxY - minY) * scaleFactor / 2;

    return new Two.Anchor(x, y);

});
Finally, we have all our points in place, and we draw the lines to connect them. This is where we really see the fruit of our labor. The shape appears on the screen, matching the blueprint you provided. If you used your toolbox to change the size of the legs or the body of the structure.
Integrating Custom HTML Containers for Drawing Display in SpreadsheetWeb
Having learned how to integrate Two.js drawing library into your SpreadsheetWeb application, the next step involves setting up visual elements that will host your drawings. These elements are crucial as they display your drawings in both an interactive and visually attractive manner. Follow this simple guide to incorporate custom HTML containers into your application.
Introducing a Content Element
The SpreadsheetWeb platform enables you to add a variety of elements to enhance your application. Specifically for drawings, you'll start by going to the 'User Interface' section. There, within the 'Outputs' category, you have the option to add a 'Content' element. This element is designed to be flexible, accommodating both static and dynamic content on your page.


Modifying Content to Embed HTML
Once you've added the 'Content' element, you'll find an 'Edit Content' button. Clicking on this button opens up an editor, enabling you to create the content that will appear on your application page. To tailor the content for our needs, switch to the 'Code View' mode. By doing so, you gain access to the HTML source code of the content area, where you can insert custom HTML code.

Adding the Chart Container
While in 'Code View', you have the ability to embed HTML code, for example, <div class="my-drawing"></div> This snippet of code establishes a div element assigned with a 'my-drawing' class. Think of it as marking a specific zone on your page designated for displaying your visualizations made by Two.js drawing library.

Displaying the Visualization
After incorporating the HTML container into your content, the chart you've programmed will automatically know its rendering location on the SpreadsheetWeb page. This allows you to view your Two.js drawing directly within the user interface, seamlessly integrating your data with visual elements.
Guided Steps for Implementation:
Let's simplify the process into manageable steps:
- Navigate to the 'User Interface' section of your SpreadsheetWeb application.
- In the 'Outputs' section, insert a 'Content' element.
- Select 'Edit Content' and then switch to 'Code View'.
- Input or paste your custom HTML code, such as a div for your chart.
- Save your modifications and observe your Two.js diagram animate on the webpage.
By adhering to these straightforward steps, you'll be able to enrich your SpreadsheetWeb applications with interactive and visually appealing charts, boosting both their functionality and visual impact.
Styling Drawings with CSS in SpreadsheetWeb
To tailor the aesthetics of your drawings within SpreadsheetWeb, the stylesheet property offers a vast canvas for creativity. This functionality allows you to inject your own touch of branding and design preferences through custom CSS coding. Explore how this property can be leveraged to align your drawings' appearance with the distinct style of your application.
Exploring the Stylesheet Property
The stylesheet property within SpreadsheetWeb serves as a dedicated area for incorporating your custom CSS code. CSS (Cascading Style Sheets) is the styling language for HTML documents, influencing colors, layout, fonts, and importantly, the appearance of drawings made with Two.js. This property provides the freedom to customize your visual content to match your application's unique aesthetic.
Navigating to the Stylesheet Property
To utilize the stylesheet property, follow these steps:
- Go to the "SW Designer Page" section within your SpreadsheetWeb application.
- Search for the 'Stylesheet' area, a designated space where you can enter CSS code.
This is typically found in the design or settings panel of your application editor.
Writing Custom CSS for Your Drawing
Basic Style for ‘.my-drawing’
.my-drawing {

  max-height: 768px;

  height: 50vh;

  width: 100%;

}
- .my-drawing: This selector targets the HTML element with the class my-drawing, which is where your drawing will appear.
- max-height: 768px;: This rule sets the maximum height of the .my-drawing element to 768 pixels. No matter how big the screen is, the drawing won't be taller than this.
- height: 50vh;: This rule sets the height of the .my-drawing element to be 50% of the viewport height (vh). The viewport is the visible area of the web page in your browser. So, if your browser's view is 1000 pixels tall, the drawing will be 500 pixels tall.
- width: 100%;: This makes sure the drawing stretches to fill the full width of the container it's in. If the container is the full width of the screen, so will the drawing be.
Media Query for larger screens
@media (min-width: 768px) {

  .my-drawing {

    height: 768px;

  }

}
- @media (min-width: 768px): This is a media query. It applies its styles only if the browser window is 768 pixels wide or wider. It's a common breakpoint for devices like tablets and desktops.
- height: 768px;: Inside this media query, the .my-drawing height is set to a fixed 768 pixels. This means that on larger screens (like tablets in landscape mode or desktop monitors), instead of being half of the window's height, the drawing will always be 768 pixels tall. This makes sure the drawing doesn't become too tall on big screens.
How This CSS Affects the Drawing
The JavaScript script you mentioned earlier uses a canvas or SVG element to draw shapes dynamically based on data points. The CSS here ensures that the visual representation of those shapes (the drawing) is displayed correctly within the webpage.
- On smaller screens (like mobile phones held upright), the drawing area's height adjusts to be half the screen height, ensuring it doesn't take up too much vertical space while still being large enough to be seen clearly.
- On larger screens, where vertical space isn't as limited, the drawing area has a consistent height, making the viewing experience uniform and predictable, which is particularly important for displaying detailed drawings or complex visual data.
- The width is always set to take up the full container, which is useful for responsiveness. It means that your drawing will scale in width on different devices, ensuring it uses the available space efficiently.
By combining these CSS rules with your drawing script, you ensure that users on different devices have a good visual experience of the drawing, with the drawing maintaining its aspect ratio and staying within a manageable size.