Wikipedia defines financial modeling as “the task of building an abstract representation (a model) of a real world financial situation.” Financial modeling in Excel is a crucial aspect of analyzing and representing real-world financial situations. Excel serves as a powerful tool for building abstract models that help in making informed financial decisions. Many of these financial models are built in Excel. This article delves into the basic principles of financial modeling in Excel, emphasizing the essential building blocks.
4 Essential Components of Financial Modeling in Excel
When diving into Financial Modeling in Excel, understanding its key components is crucial. The foundation of any financial model is built upon four fundamental blocks: Inputs, Data, Calculations, and Outputs.
Inputs of a Financial Model
In Excel, inputs serve as the user's starting point. They involve entering data crucial for your Financial Modeling in Excel. These inputs can range from historical financial records to investment property costs or budget estimates. Your model's complexity determines the number of data points needed, whether just a few or thousands.
For effective organization, segregate inputs in a dedicated worksheet. This separation ensures clarity and simplicity, especially in less intricate models. However, in more advanced Financial Modeling in Excel, it might be necessary to showcase both inputs and outputs together for thorough review. Observe the screenshot below, where yellow cells signify inputs, and the rest represent outputs within the financial model.

Financial Modeling in Excel is Driven by Data
Excel plays a pivotal role in Financial Modeling, primarily driven by data. In the context of Financial Modeling in Excel, data serves as the foundation for analyzing inputs. The administrator of the financial model periodically updates this crucial data. For instance, actuarial models rely on occasionally updated mortality tables, while investment models utilize mutual fund performance data, typically refreshed quarterly for accuracy.
It is important to decouple this type of data from the rest of the model in a separate worksheet (or set of worksheets). This will allow the administrator to update the data without impacting any other part of the model.
It is also recommended that each data table has a named range. Always reference the data in your formulas using its named range instead of its cell reference. It is easier to maintain a formula that references a mortality table such as =VLOOKUP(Age,MortalityTable,2,FALSE), rather than a formula like =VLOOKUP(Age,Sheet2!A1:D100,2,FALSE).
While updating your data, always make sure to check the definition of the named range, especially if you are uploading data with more rows or columns than the existing one. If you don’t adjust the named ranges, the copied data that falls outside of the original data may never be used in your calculations.
Calculations is the Engine of Financial Modeling in Excel
The heart of Financial Modeling in Excel revolves around calculations. This crucial aspect involves utilizing Excel to merge inputs and data, ultimately determining your financial outcomes.
Maintaining a clear separation of the calculation segment from the rest of your Excel model is vital. This practice enhances the ease of model maintenance. You can organize your calculations neatly on a single worksheet or distribute them across multiple sheets.
Outputs of your Financial Model
The outcomes of your financial model represent the findings you wish to present to the end user. These outcomes can manifest as a calculated cell, a table, a chart, or even a pivot table. For instance, a straightforward model might compute the cost of a product in a single cell, contingent on various user inputs. On the other hand, a more intricate model could generate an entire table of values, such as a balance sheet.

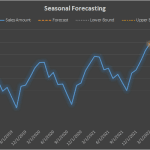
Certain models may present results in a visually appealing manner, such as through charts:

The results from your model stem from the calculations section. Whether your outputs are straightforward or intricate, it's advisable to bring them into a separate worksheet for display purposes. This applies even if it involves some duplication, as it simplifies the maintenance of your financial model.
In conclusion, mastering financial modeling in Excel is pivotal for effective decision-making in the realm of finance. Excel's role as a powerful tool for constructing abstract representations of real-world financial situations cannot be overstated. The four essential components—Inputs, Data, Calculations, and Outputs—form the foundation of any financial model. Inputs serve as the starting point, with data acting as the driving force, periodically updated to ensure accuracy.
Calculations, the engine of financial modeling, merge inputs and data to determine outcomes, emphasizing the need for clear organization. Finally, outputs represent the end results, presented in a user-friendly format such as tables or charts. Regardless of the model's complexity, separating these components in Excel ensures clarity, simplicity, and ease of maintenance, underscoring the importance of Excel in financial modeling.