Big or small, all business operations need forecasting. Forecasting can be either qualitative or quantitative. In the end, you should estimate future incomes and expenses to draw up a budget. Since each business sector and the company have their own dynamics, there is not a universal forecasting solution. Seasonality is one of the most important tools to determine the diversity and personalize the forecasting. In this guide, we’re going to show you How to seasonal forecast with formulas in Excel.
Data
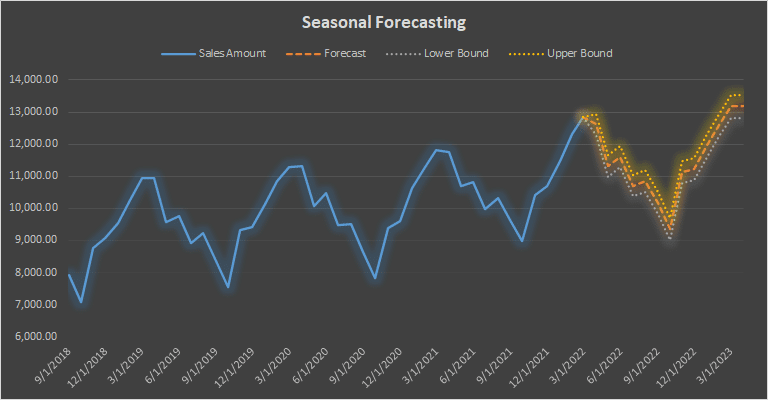
We have a sample sales data between 9/1/2018 and 3/1/2022. Our intention is to forecast sales amount up to 4/1/2023.

Excel Functions
Excel 2016 was released with a new forecasting formula set. The new formulas, except the FORECAST.LINEAR, can be used to predict a future value based on existing values with a seasonal pattern. Microsoft states that they are using the AAA version (additive error, additive trend, and additive seasonality) of the Exponential Smoothing (ETS) algorithm which is an advanced machine learning algorithm.
| FORECAST.ETS | Forecasting with Exponential Triple Smoothing |
| FORECAST.ETS.SEASONALITY | Seasonality in forecasting using Exponential Triple Smoothing |
| FORECAST.ETS.CONFINT | Confidence interval in forecasting using Exponential Triple Smoothing |
| FORECAST.ETS.STAT | Statistical values in forecasting using Exponential Triple Smoothing |
| FORECAST.LINEAR | Linear regression-based forecasting (Same with legacy FORECAST) |
Seasonal Forecasting with Formulas
Automatic Seasonality
The main function is FORECAST.ETS can return the predicted value. The other functions using "FORECATS.ETS" prefix are helper functions that help us to understand the metrics behind the forecasting.
You need to enter the date you want to predict and its value (target_date), along with historical values (values) and the corresponding dates (timeline) to run the function in its default state.
In default, the function
- calculates the seasonality automatically,
- use the average of the neighboring points for missing data
- and use the AVERAGE function to aggregate the values with the same time stamp.

Of course, a single forecasted value does not tell much. You need to populate more to see if the values are tracking a trend and resemble the actual data. Copy the formula while keeping historical value ranges intact. See absolute and relative references.

Do not hesitate to create a chart to visualize your data. Visualization is a great way to transcribe the big picture.
Custom Seasonality
If the forecasting with automatic seasonality does not satisfy your expectations, you can always set a number that determines the number of the periods in a single season (seasonality). Just add the seasonality number as the 4th argument into your formula. The value should be between 2 and 8760 (number of hours in a year).
0 means no seasonality and 1 is meant for automatic which is the default value already.
Here is a chart that shows differences between seasonality values:

Helper Functions for Seasonal Forecasting
Fortunately, Excel does not leave their user with a trial-and-error process during determining of seasonal forecasting parameters. You can learn the seasonality value Excel calculates, the confidence intervals of the prediction and statistical values like parameter values (base, trend, seasonality) or error metrics (MAE, RMSE, etc.).
Automatic Seasonality
Use the FORECAST.ETS.SEASONALITY function to see the same season length which is calculated by the FORECAST.ETS function automatically. All you need to do is to use the same arguments with the FORECAST.ETS function.

Confidence Intervals
Calculating the confidence intervals is a good way to measure the accuracy of the forecasting. A confidence interval displays the probability of a parameter will fall between a pair of values around the forecasted value. The FORECAST.ETS.CONFINT function can return the value that you can calculate the lower and upper bounds of the interval.
The default value for the confidence_level argument is 95%. Omit the argument to calculate the confidence level for the 95% or give it a custom percentage value. Obviously, you need to use the same arguments that you are using in the FORECAST.ETS function.
You need to add and subtract the value from the forecasted value to find the interval. Once again, use a chart to visualize the forecast in the confidence interval.

Statistical Values
Finally, the FORECAST.ETS.STAT function can return a determined statistical value based on given arguments. Supply the statistic_type argument to select which statistical value you want to return. The remaining arguments are similar to the FORECAST.ETS function.
| statistic_type | Statistic Name | Description |
| 1 | Alpha parameter of ETS algorithm | Returns the base value parameter—a higher value gives more weight to recent data points. |
| 2 | Beta parameter of ETS algorithm | Returns the trend value parameter—a higher value gives more weight to the recent trend. |
| 3 | Gamma parameter of ETS algorithm | Returns the seasonality value parameter—a higher value gives more weight to the recent seasonal period. |
| 4 | MASE metric | Returns the mean absolute scaled error metric—a measure of the accuracy of forecasts. |
| 5 | SMAPE metric | Returns the symmetric mean absolute percentage error metric—an accuracy measure based on percentage errors. |
| 6 | MAE metric | Returns the symmetric mean absolute percentage error metric—an accuracy measure based on percentage errors. |
| 7 | RMSE metric | Returns the root mean squared error metric—a measure of the differences between predicted and observed values. |
| 8 | Step size detected | Returns the step size detected in the historical timeline. |