Resources
How to use IFS and SWITCH formulas instead of nested IF statements
Nested IF statements are useful for creating more complicated scenarios in Excel. However, IFS and SWITCH formulas can work more efficiently when dealing with more than one condition. These formulas work a bit differently than the legacy IF function. Let's...
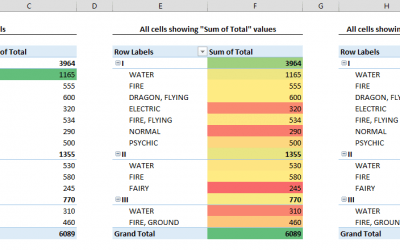
How to apply conditional formatting to Pivot Tables
Conditional Formatting is commonly used to highlight data fields to easily identify outliers, or narrow down the results. However, this feature works a bit differently when dealing with a Pivot Table. Pivot Tables are also dynamic elements, and conditional...

How to make a line graph in Excel
Widely used in various fields, a line chart is one of the staples of data visualization. Line graphs (charts) are a graphic representation of data shown on lines across the chart area. In a line chart, lines typically represent categories, and are drawn between data...

How to compare two columns in Excel
Comparing the data in two different columns is a frequently used method in data analysis. In Excel, you can compare using formulas or highlighting. In this guide, we’re going to show you how to compare two columns in Excel using these two methods.Compare...
How to wrap text in Excel
By default, Excel will cut off the characters that don't fit into a certain space. An alternative approach is wrapping the text to fully display it by increasing the cell height. In this guide, we’re going to show you how to wrap text in Excel. These...

How to create a gauge chart in Excel
A gauge chart (also known as dial or speedometer) is a type of visualization that typically displays one data field on a maximum-minimum scale. The fact that a single value is shown sets gauges aside from other visualizations.Although gauges are commonly...
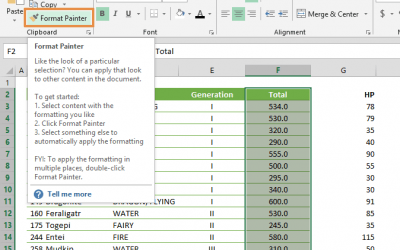
How to use format painter in Excel
The Format Painter is the life saver when you need to copy only the formatting settings from one section to the other in your spreadsheet. In this guide, we’re going to show you how to use format painter in Excel. The best part is, this feature is...
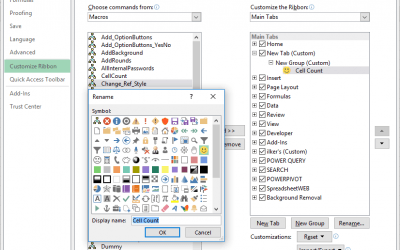
How to add a custom button to Excel Ribbon
Ability to add a custom button helps you quick access to your macros or favorite actions directly from the Ribbon. The Ribbon was introduced in 2007 and made customizable with Excel 2010. So you can use this trick in all versions starting with 2010. This...

How to show named ranges that were made hidden using VBA
Hidden named ranges can be tricky to find and work with. This article will guide you through how you can show named ranges that were hidden using VBA.How to show named ranges that were hiddenNamed ranges are objects in a workbook's Names collection and...