
Human resources demo
HR Dashboard
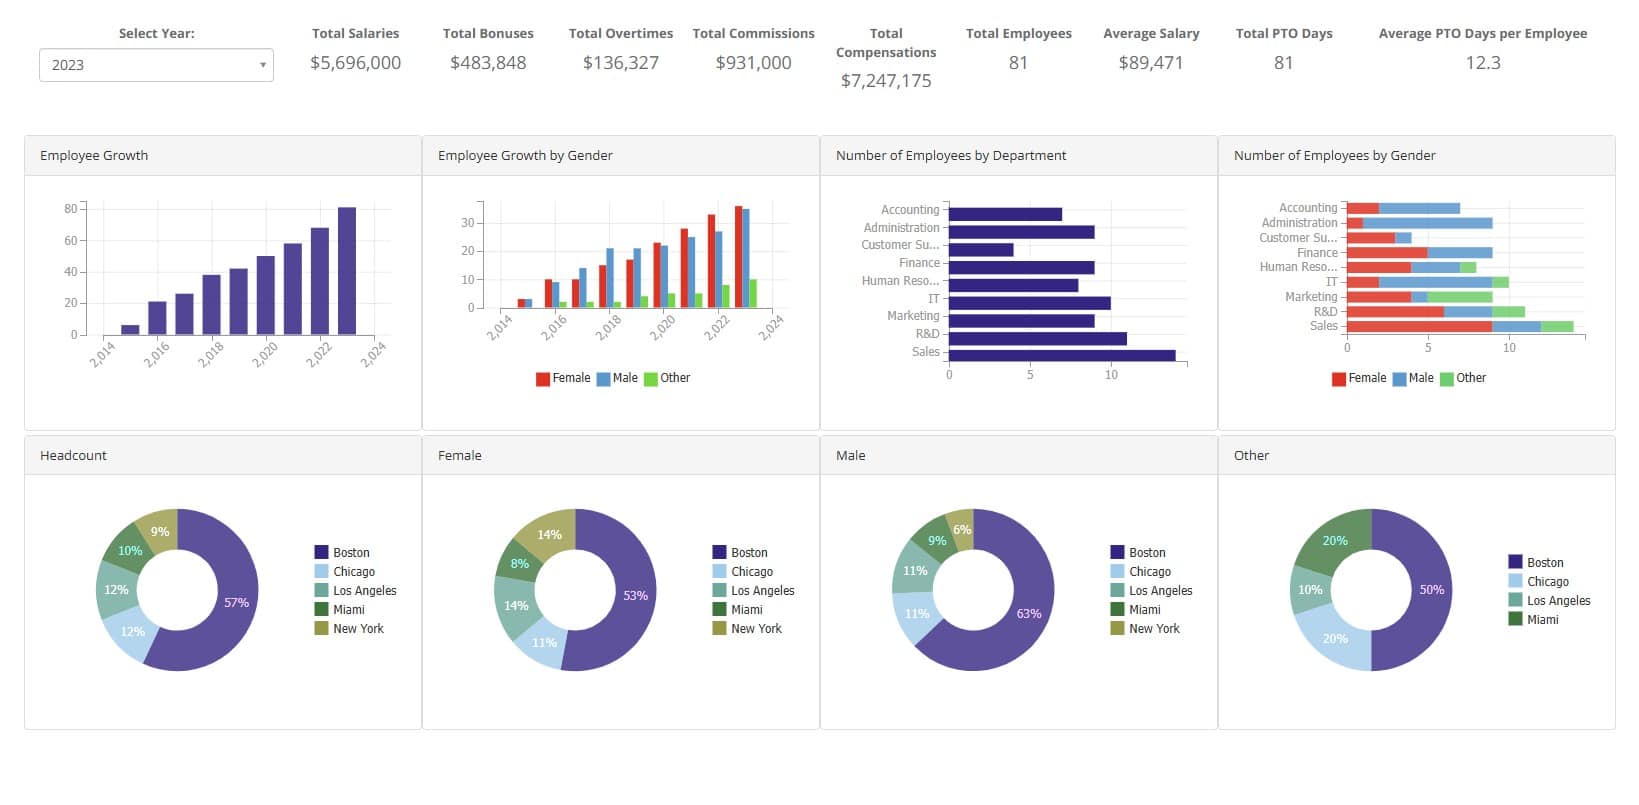
Explore workforce growth, compensation, PTO, department, gender, and location measures through a focused dashboard powered by a published spreadsheet model.
SpreadsheetWeb application example
About this human resources dashboard
HR leaders often need a clear view of payroll and workforce composition without distributing a complex source workbook. This dashboard turns the published spreadsheet into a responsive browser experience while preserving its calculations.
Choose any available year to update every metric and visualization together. The dashboard combines executive compensation totals with historical headcount, department composition, gender representation, and location distribution.
Live workbook dashboard
See the workforce from every angle
Select a reporting year. The published workbook recalculates the complete dashboard automatically.
Workforce trend
Employee growth
Representation trend
Employee growth by gender
- Female
- Male
- Other
Organization
Employees by department
Representation
Employees by gender
- Female
- Male
- Other
Geographic mix
Workforce by location
Share of each selected-year group across five offices.
Headcount
- Connecting to the workbook…
Female
- Connecting to the workbook…
Male
- Connecting to the workbook…
Other
- Connecting to the workbook…
View department data Accessible chart data
| Department | Headcount | Female | Male | Other |
|---|---|---|---|---|
| Waiting for calculated department data. | ||||
The information provided by this dashboard is intended for demonstration and educational purposes. Figures represent the published sample workbook and should not be treated as guidance for employment, compensation, or workforce decisions.
A connected workforce view
Turn HR records into decision-ready insight
A year filter gives every chart the same reporting context. Compensation cards summarize payroll, while trend, department, gender, and location views reveal how the organization changes over time.
Review salaries, bonuses, overtime, commissions, and total compensation together.
Compare total headcount and gender representation across nine years.
See which functions drive headcount and how representation varies by team.
Understand where the overall workforce and each reported gender group are based.
Practical applications
Bring spreadsheet-based HR reporting to the browser
- Leadership reportingGive decision-makers a concise view of compensation and organizational growth.
- Workforce planningCompare headcount patterns by year, department, gender, and office.
- HR operationsPublish repeatable workbook calculations without circulating the source file.
- Dashboard prototypingValidate an HR reporting model before connecting it to production data sources.
Frequently asked questions
About this HR dashboard
What does the year filter change?
It recalculates the compensation metrics, selected-year department charts, and location distributions. Historical growth charts continue to show the full 2015–2023 trend.
Where do the calculations run?
The browser sends only the selected year to this website. A server-side gateway authenticates with SpreadsheetWeb and returns a validated, application-specific result.
Can this pattern use private HR data?
The demo uses a sample workbook. A production implementation should add appropriate user authentication, authorization, data controls, auditing, and privacy review for employee information.
Can the dashboard connect to other systems?
SpreadsheetWeb applications can participate in broader workflows with databases and APIs, subject to the architecture and security controls selected for the implementation.