
Skip to content
SpreadsheetWeb
FeaturesPricingBlogCustomersEnterpriseGallery
Sign up for freeSign In
FeaturesPricingBlogCustomersEnterpriseGallery
Sign up for freeSign In

Interactive dashboard

COVID-19 Cases

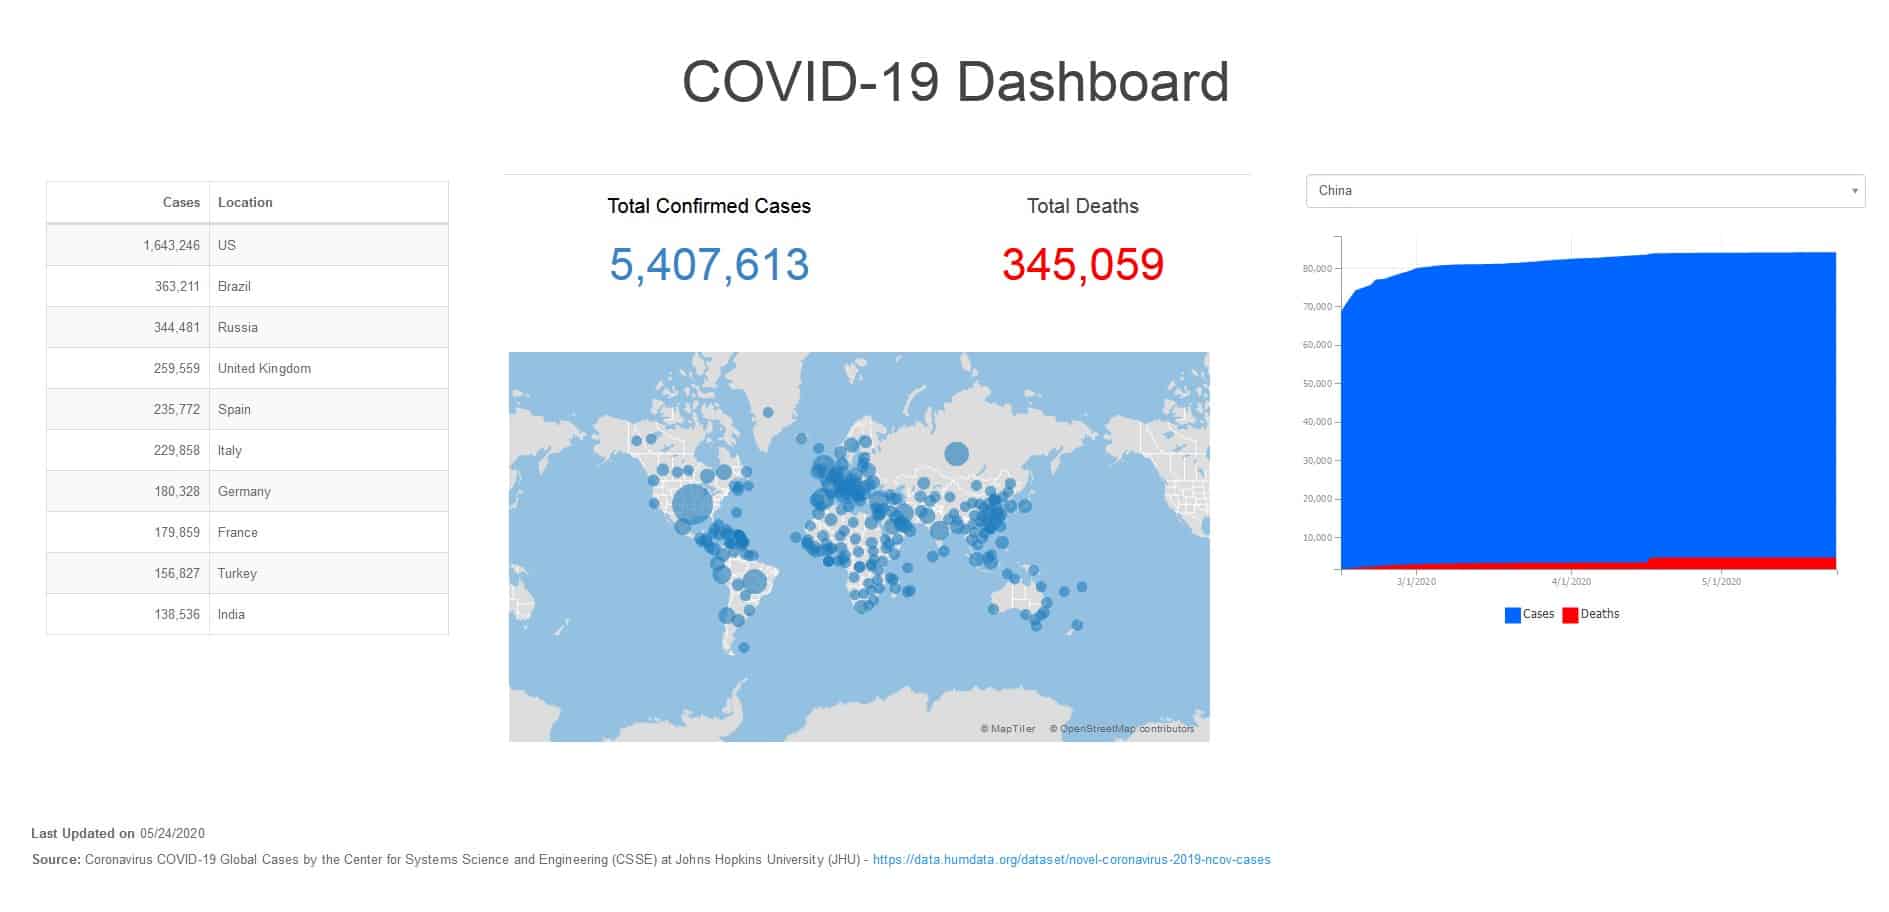
Explore COVID-19 Cases, an interactive dashboard built with SpreadsheetWeb. See how metrics, charts, and reported results can be presented in a browser.
Try the applicationBrowse all applications
COVID-19 Cases

SpreadsheetWeb application example

About this dashboard

COVID-19 Cases demonstrates how metrics, charts, and reported results can move from a spreadsheet into an accessible web interface. The embedded application below is a live example built with SpreadsheetWeb.

Use the application to explore the available views and review the information presented by the dashboard. You can also open the demo in a separate tab for a full-page view.

What this demo shows

  • A browser interface for metrics, charts, and reported results
  • Interactive behavior powered by the underlying spreadsheet model
  • A live example that can be explored without installing a desktop workbook

Live application

Try COVID-19 Cases

Interact with the application below, or open it in a separate tab for a full-page view.

Open full page

Build from your spreadsheet

Turn an existing spreadsheet model into a web application

Explore more examples in the gallery or talk with the SpreadsheetWeb team about your application.

Contact usView more demos

Product

FeaturesGalleryCustomersDevelopers & APITemplates

Solutions

IndustriesMarketingHuman ResourcesFinanceSales

Use Cases

Online CalculatorsSales QuotingTimesheet AppsScored QuestionnairesSearch ApplicationsReporting Applications

Support

User GuideTraining VideosCase StudiesTips

Resources

BlogExcel ApplicationsExcel Tips & TricksExcel FormulasExcel MacrosExcel Templates

About

About UsContact UsServices

© Pagos, Inc. - All rights reserved - Privacy Policy - Terms of Use -

FacebookXLinkedIn