Skip to content
SpreadsheetWeb
FeaturesPricingBlogCustomersEnterpriseGallery
Sign up for freeSign In
FeaturesPricingBlogCustomersEnterpriseGallery
Sign up for freeSign In

Interactive calculator

Cost Curves Calculator

Try our Cost Curves Calculator. Enter fixed and variable costs to generate total, average, and marginal cost curves instantly online.

Try the applicationBrowse all applications
Cost Curves Calculator

SpreadsheetWeb application example

About this calculator

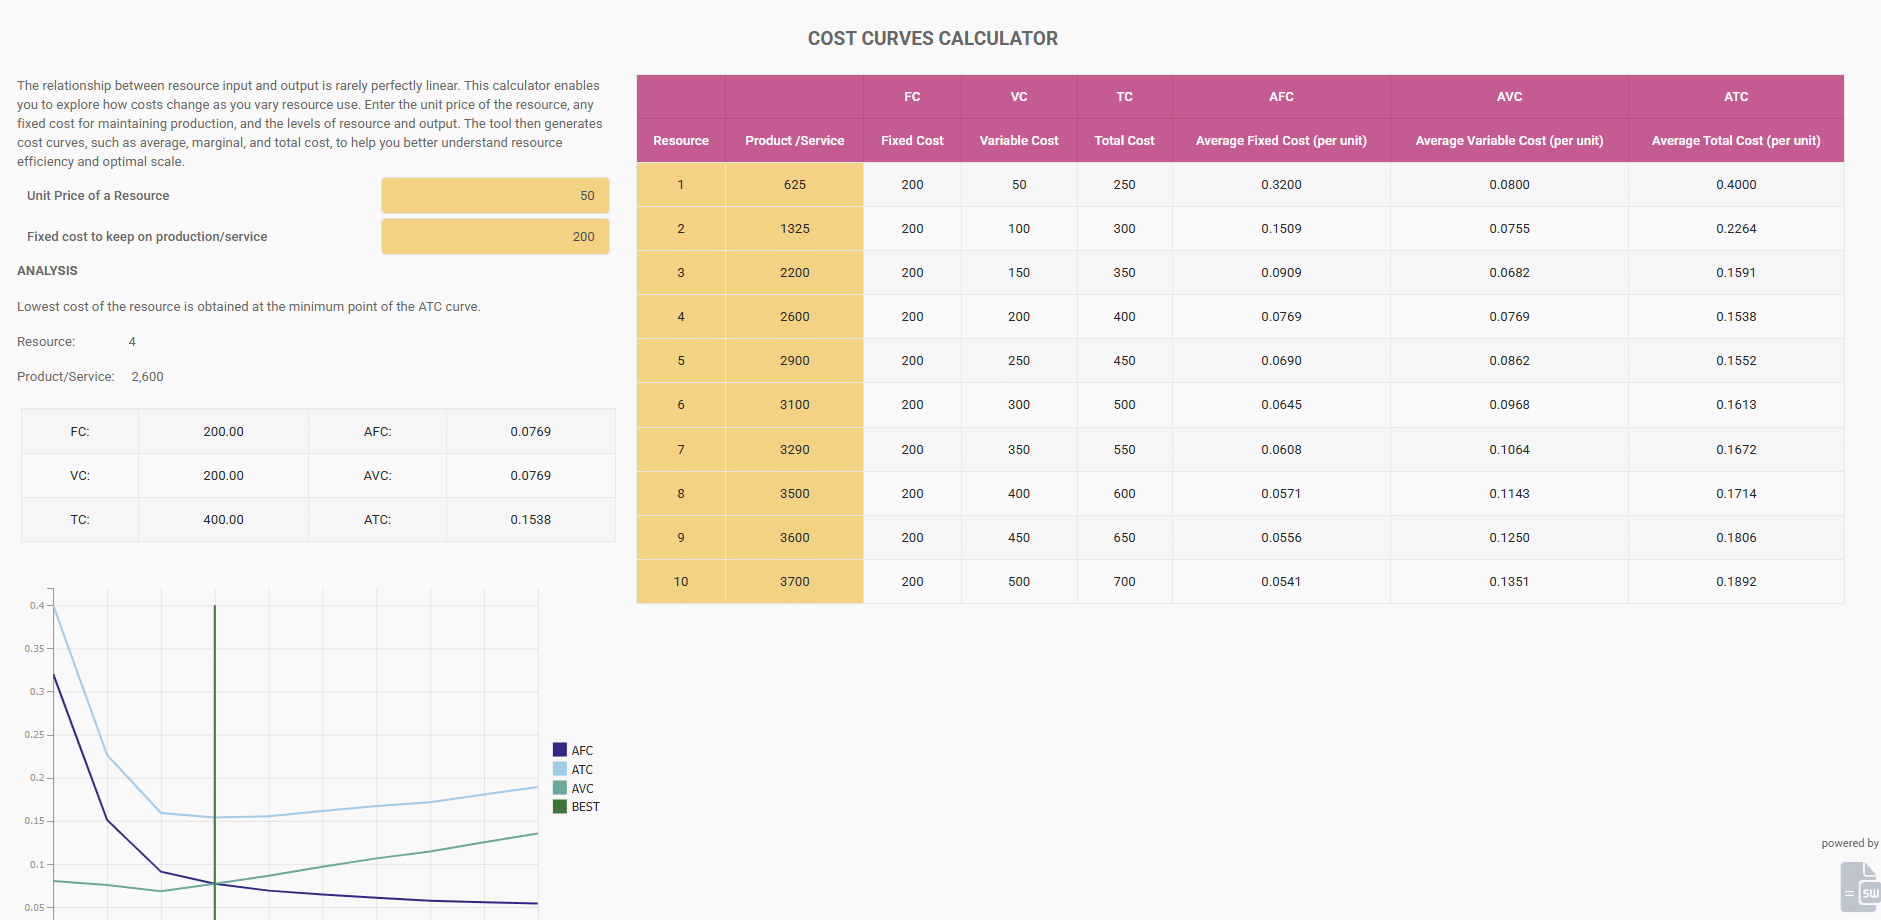
Cost Curves Calculator Demo — Visualizing Production and Cost Relationships demonstrates how inputs, spreadsheet calculations, and calculated results can move from a spreadsheet into an accessible web interface. The embedded application below is a live example built with SpreadsheetWeb.

Use the application to enter example values and review how the calculated output responds. You can also open the demo in a separate tab for a full-page view.

What this demo shows

  • A browser interface for inputs, spreadsheet calculations, and calculated results
  • Interactive behavior powered by the underlying spreadsheet model
  • A live example that can be explored without installing a desktop workbook

Live application

Try Cost Curves Calculator

Interact with the application below, or open it in a separate tab for a full-page view.

Load Application in Full Page

In microeconomics and business analysis, costs rarely increase in a straight line with output. Understanding how fixed, variable, average, and marginal costs behave across different production levels is key for evaluating efficiency and decision-making.

This Cost Curves Calculator shows how SpreadsheetWeb can transform an Excel cost model into a fully interactive web application.


What Does the Cost Curves Calculator Do?

The calculator allows users to input:

  • Fixed costs: Overheads or baseline expenses that do not change with output.
  • Variable costs: Costs tied directly to resource usage or production quantity.
  • Unit price and resource levels: Inputs that affect total and marginal cost calculations.


Based on these inputs, the cost curves calculator generates interactive graphs of:

  • Total cost
  • Average cost
  • Marginal cost

These curves help explain economies of scale, efficiency thresholds, and decision points in production.


Key Features

  • Instant results: Update cost curves as soon as you change inputs.
  • Excel logic preserved: All formulas and cost functions from the spreadsheet are maintained.
  • Visual insights: Dynamic charts illustrate relationships between cost and output.
  • Mobile friendly: Access the calculator from any device without downloads.
  • Educational and practical: Suitable for teaching economics or analyzing real-world business scenarios.


Applications of Cost Curves

  • Economics education: Teach students about fixed, variable, average, and marginal costs.
  • Business analysis: Model production costs and identify efficiency ranges.
  • Operations planning: Evaluate scaling strategies and optimal output levels.
  • Policy research: Study cost structures in industries and market regulation.


Why Convert Excel Cost Models to Web Apps?

  • Accessibility: Run models online without sharing spreadsheets.
  • Consistency: Guarantee correct formulas and eliminate version sprawl.
  • Interactivity: Real-time results with visual cost curves.
  • Scalability: Share with students, analysts, or teams worldwide.


FAQ

What are cost curves?

Cost curves illustrate how total, average, and marginal costs change as production output increases. They are fundamental tools in economics and operations analysis.


What inputs does this cost curves calculator require?

You enter fixed costs, variable costs, and unit/resource levels. The cost curves calculator then computes total, average, and marginal costs.


Who can use this calculator?

It is useful for students, teachers, business analysts, and professionals modeling production costs and efficiency.


Can I embed this calculator into my own site?

Yes. SpreadsheetWeb allows you to embed calculators and models into your website or share them as standalone apps.


Note: This cost curves calculator was created by converting an Excel cost model into a web application using SpreadsheetWeb, preserving formulas while adding interactive charts and modern UI.

Build from your spreadsheet

Convert My Excel Model to a Web App

Explore more examples in the gallery or talk with the SpreadsheetWeb team about your application.

Sign-up for a free accountView more demos

Product

FeaturesGalleryCustomersDevelopers & APITemplates

Solutions

IndustriesMarketingHuman ResourcesFinanceSales

Use Cases

Online CalculatorsSales QuotingTimesheet AppsScored QuestionnairesSearch ApplicationsReporting Applications

Support

User GuideTraining VideosCase StudiesTips

Resources

BlogExcel ApplicationsExcel Tips & TricksExcel FormulasExcel MacrosExcel Templates

About

About UsContact UsServices

© Pagos, Inc. - All rights reserved - Privacy Policy - Terms of Use -

FacebookXLinkedIn