Power Query, a dynamic and robust add-in for Excel, is a game-changer for business users dealing with data. As we all know, data can come in various forms and from diverse sources, making it challenging to manage and analyze. Moreover, reporting tools often have specific requirements for the data they can process.
Power Query excels in manipulating and cleaning up data tables, making it an essential tool for maintaining a clean database structure and generating reports. It’s a powerful tool that can reshape data to meet the demands of any reporting tool, ensuring that your data analysis is as accurate and efficient as possible. When you’re dealing with data in Excel or Power BI, Power Query is your go-to tool for data transformation and preparation. It simplifies the process of discovering, connecting, and refining your data, making it an important part of any data analysis workflow.
What is Power Query?
Power Query, also known as Get & Transform, is a free add-in that forms an integral part of Microsoft’s ‘Power Suite’. It’s a tool that enables you to search for data sources, establish connections between them, and transform and shape that data to suit your needs.
For Excel 2010 and 2013, Power Query can be downloaded as an optional add-in. However, starting with Excel 2016, it comes as a built-in feature, enhancing the capabilities of Excel for data analysis.
Power Query is adept at performing various data transformation tasks, such as:
- Finding and replacing text
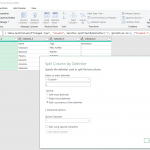
- Splitting or merging columns
- Sorting and filtering columns
- Adding static or calculated columns
- Unpivoting data for use in pivot tables
One of the key features of Power Query is its use of a formula language called "M". This mashup query language, designed to build data queries, is similar to F-Sharp in several ways. According to Microsoft, it “is a mostly pure, higher-order, dynamically typed, partially lazy, functional language.”
In Excel 2016 and later, the add-in is featured as “Get & Transform”. You can find it under the Data tab of the ribbon in the Get & Transform section.
For users of Excel 2010 and 2013, the add-in can be downloaded from Microsoft’s official website. Both 32-bit and 64-bit versions are supported. However, it’s important to note that Power Query is not compatible with any Mac versions of Excel.
Connect to a Data Source Using Power Query
Connecting to a data source is the first step in leveraging the power of Power Query. If you’re using Excel 2016 or a newer version, the process is quite straightforward:
- Navigate to the Data tab in Excel.
- Click on New Query. This will open a dropdown menu with various options for data sources.
- You can choose to pull data from your workbook, an external database, or another workbook.
Power Query allows you to easily connect to, transform, and shape data from various sources, whether it's in your workbook, an external database, or another workbook. It streamlines data transformation and analysis.

For users of Excel 2010-2013, the process to connect to a data source is slightly different but still quite simple. Click on the Power Query tab in Excel. This will open a ribbon with various options. From here, you can access the same features to connect to your data source.

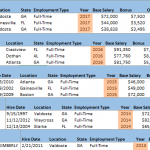
Go to the Data tab and click New Query to connect to your data source. Use the Power Query tab for the same function. Once connected, the Navigator window lets you preview and select the table(s) to import from your data source. Choose your table(s) and click ‘Load’ to import the data into Power Query.

After selecting your table(s) in the Navigator window, either double-click the table name or click Edit. This will allow you to review and modify the data before importing it into Power Query. Repeat this process for each table you want to import.
Shape & Transform the Data
After connecting to your data source, the selected data will populate the Query Editor window. Here, you can shape and transform your data as needed. This process is the same for each table you import into Power Query.

In the Query Editor, you can:
- Reshape data and save queries using the toolbar.
- Track all changes in the APPLIED STEPS section.
- Manage other queries from the expandable Queries pane.
Remember, Power Query won’t override your original data. It logs each step under APPLIED STEPS, allowing you to modify, update, or reorder these steps. Right-click on a step to see available options. This process applies to each table you work with in Power Query.

For a more detailed view of your query, click the Advanced Editor button under the Home tab. This allows you to see the underlying code of your query. Additionally, Power Query’s M Language lets you create custom queries from scratch, offering a higher level of customization for your data transformation needs. This process is the same regardless of the data source or table you’re working with in Power Query.

We can access the Query Editor at any time by clicking the Launch Editor icon on the ribbon.

Loading the Table
Click Close & Load to send the queried data back to Excel as a data Table.

After loading your data into Power Query, you’ll notice a new pane on the right side called Workbook Queries. This pane displays all existing queries and allows for various data operations. You can copy data, merge it with other queries, or share it via the Data Catalog. This functionality is consistent across all data sources and tables in Power Query, providing a unified and efficient data management experience.

Alternatively, you can load your table by clicking Close & Load under the arrow next to the Close & Load icon. If you want to create an Excel Connection without a Table, or if you want to insert the data into a Data Model for use with Power Pivot, you can do so by right-clicking on Workbook Queries and selecting Load To…

Power Query can answer most data configuration operations in Excel. It’s the perfect tool for reshaping data, and can be a life-saver when it comes to analyzing data and reporting.