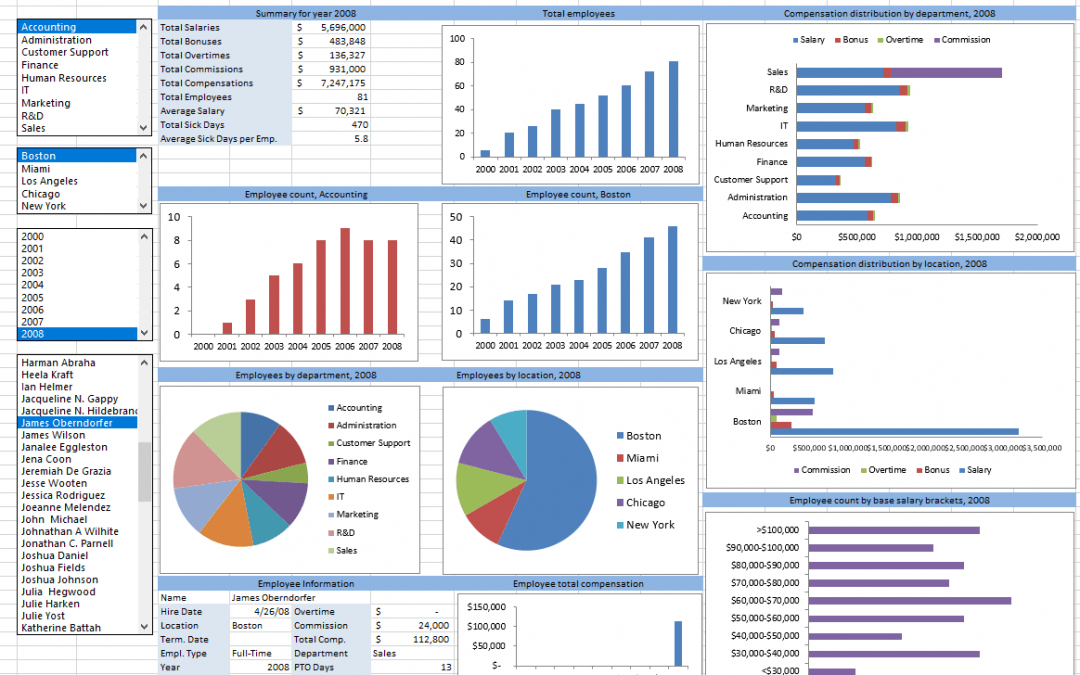
This human resources dashboard template in Excel visualizes various employee and HR related measures in an interactive manner. It allows human resources managers and senior management quickly view employee statuses including payroll, sick days, employee performances by year, location, department as well as by individual employee level in Excel. You can update underlying data with your own to customize with for your company.
Let's go through each tab and what they do.
The Dashboard sheet consists of the visualizations that use the data fed from the Employee Data sheet. The filters on the left hand side of the page allow narrowing down data being displayed.
The Employee Data sheet consists of a table where you can enter employee information. Employee data entered into this page should automatically appear on the Dashboard visualizations. If you delete or add any columns, make sure that you make these changes in corresponding visualizations as well.
Calculations sheet is where data is being aggregated. Charts pull the data from this page. Making changes to the formulas here might require you to make accommodating changes on the charts as well.
You can find the data being used in the filters under the Lists sheet. Remember to update these lists based on what options you'd like to see on the Dashboard page filters. Lists in filters on the Dashboard sheet is populated from this page.
Start 'cleaning up' the workbook from the existing data by removing the data from the Employee Data and Lists tabs of the human resources dashboard.
The 'types of data' you enter for employees must match the options available in the List sheet for the filters to be able to work with your data. For example, if you need to use different locations, these changes will have to be made both in the Lists and Calculations tabs to accommodate for the visualizations and filters.

You can now start entering your employee data into the Employee Data tab of the human resources dashboard. Entering employee information into the Employee Data tab should now populate the data on the Dashboard page. You can narrow down the results using the updated filter options.