The Exchange Rates Historical Lookup Excel Template is an advanced tool designed to understand the historical trends of global currencies, offering valuable insights for those involved in financial markets. Aimed at financial analysts, traders, investors, and anyone with an interest in the behavior of currency markets, this template is more than just a data repository. It's a window into the past performance of currencies, providing a nuanced understanding of their movements over time.
What sets this template apart is its ability to dissect and present complex currency data in a user-friendly manner. It's designed to accommodate the needs of both financial professionals and individuals new to currency analysis, ensuring that its utility spans a broad spectrum of users. At its core, the template facilitates a detailed analysis of how different currencies have performed in the past. This historical perspective is crucial for several reasons:
Informed Decision Making: Understanding past currency trends is vital for making informed decisions about future investments. This template provides a clear historical view, allowing users to spot patterns, understand market cycles, and forecast potential future trends based on past data.
Risk Management: For investors and traders, managing risk is a key part of their strategy. By examining the historical performance of currencies, users can gauge their volatility and stability over time, aiding in the development of a diversified and balanced investment portfolio.
Strategic Planning: The template aids in strategic planning by providing insights into how currencies respond to global events, economic shifts, and policy changes. This information is invaluable for planning long-term investment strategies and understanding the broader economic landscape.
Ease of Use: Despite its comprehensive capabilities, the template is designed with user experience in mind. It presents data in an easily digestible format, making complex currency trends accessible to all users.
As you can see, the Exchange Rates Historical Lookup Excel Template is a potent tool for anyone looking to deepen their understanding of global currency trends. Its blend of detailed historical data, and ease of use makes it an invaluable asset for a wide range of financial activities, from personal investment planning to professional market analysis.
In-Depth Functionality of the Exchange Rates Historical Lookup
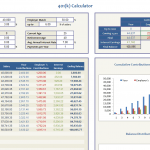
Dashboard Worksheet Features:
Multi-Currency Comparison: The dashboard enables the comparison of up to five currency pairs simultaneously. This feature allows users to select a primary currency and a corresponding base currency for each comparison, providing a comparative analysis of their relative value over time.
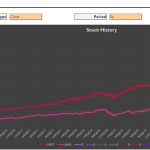
Graphical Visualization: A key feature of the dashboard is its ability to graphically represent the historical exchange rates of chosen currency pairs. This visualization aids in quickly grasping market trends and fluctuations.
Customizable Time Frames: Users can select from various predefined time frames for their exchange rates historical lookup, including options like 1 month, 3 months, 6 months, 1 year, 2 years, and 5 years. This flexibility ensures that users can tailor their analysis to specific investment or research needs.
Currency History Worksheet:
The Currency History worksheet serves as a detailed repository of historical exchange rates. It provides an extensive record of currency performances, enabling users to conduct a thorough analysis of trends, patterns, and anomalies in currency markets over extended periods. That means the worksheet itself is a database of global currencies, listing countries, their respective currencies, and accompanying codes. It serves as a reference point for identifying and selecting currencies for analysis, ensuring accuracy in the user's exchange rates historical lookup.
Utilizing the STOCKHISTORY Function in Excel:
The STOCKHISTORY function in Microsoft Excel is a groundbreaking tool for financial analysis, particularly useful for those requiring access to historical financial data. It's a part of Excel for Microsoft 365 and Excel Online, designed to retrieve historical data for stocks, indices, and currencies. The function in Excel has significantly improved the way financial data is accessed and analyzed, offering notable benefits to a wide range of users, including financial analysts and individual investors. The function represents a step forward in financial data management, facilitating easier access to historical data and enhancing the analytical capabilities of its users.
One of the most notable features of the STOCKHISTORY function is its ability to pull data for a specific range of dates and at varying frequencies. Users can specify their desired start and end dates and choose how frequently they want the data to be retrieved – daily, weekly, or monthly. This flexibility allows for a highly tailored approach to data analysis, suiting various analytical needs and strategies.
The function also offers multiple data points for each security, including opening price, highest and lowest prices, closing price, and even trading volume. This comprehensive set of data points provides a more complete picture of a security's historical performance, enabling more nuanced and informed analysis.
Ease of use is another aspect of the STOCKHISTORY function. Users need only enter the stock symbol, the time frame, and other optional parameters to get a detailed historical dataset. This ease significantly reduces the time and effort traditionally associated with gathering and analyzing financial data, making it accessible to users.
What sets STOCKHISTORY apart is its use of dynamic arrays in Excel. When a user inputs a formula, Excel automatically adjusts and spills the resulting array into adjacent cells. This feature is incredibly beneficial when dealing with extensive data sets, eliminating the need for manual cell adjustments and potential errors.
STOCKHISTORY is an invaluable tool for financial professionals and enthusiasts. It supports various applications in financial analysis, including historical trend analysis, stock performance evaluation over different economic conditions, and data-driven investment decision-making.
Application in Financial Analysis:
Exchange rates historical lookup is not just a feature; it's a critical component in financial analysis and portfolio management. This tool allows users to evaluate currency performances during different economic cycles, assess risk exposure in foreign investments, and make predictions based on historical trends. It's particularly useful for understanding the effects of geopolitical events, monetary policies, and global economic shifts on currency values. In a world where hundreds of currencies are in circulation, identifying the best-performing currencies for value storage is vital for financial portfolio management. The Historical-Exchange-Rate-Comparison template, driven by the sophisticated STOCKHISTORY function in Excel, is tailored for this purpose. It enables users to compare up to five currencies, offering options to analyze metrics like opening price, closing price, and trading volume. The inclusion of a real-time updating chart enhances the user experience, making it a robust tool for those aiming to diversify their investments and manage the risks associated with currency fluctuations in different geopolitical and geographical contexts.
Strategic Use of Exchange Rates Historical Lookup:
Incorporating the practice of exchange rates historical lookup into financial strategy and portfolio management is a strategic measure for those navigating the complexities of the currency market. This approach is particularly beneficial for different groups of financial market participants.
For Investors: Investors seeking to hedge against currency risk find this tool particularly invaluable. By examining historical exchange rate data, investors gain insights into currency volatility and trends, enabling them to make more informed decisions about currency hedging. This historical perspective allows them to anticipate potential risks and opportunities in foreign exchange markets, thereby optimizing their investment strategy to mitigate losses and capitalize on gains.
For Financial Analysts: Financial analysts, tasked with predicting currency movements, rely heavily on historical data. The ability to analyze past currency trends gives them a foundational basis for forecasting future movements. This is crucial in a market where past patterns and behaviors can often provide clues to future trends. Analysts can use this data to identify correlations between currency movements and macroeconomic indicators, enhancing the accuracy of their forecasts.
For Businesses in International Trade: Businesses engaged in international trade use exchange rates historical lookup to strategize their transactions and hedge against potential losses due to currency fluctuations. By understanding historical exchange rate trends, these businesses can better time their currency conversions and transactions, leading to more favorable exchange rates and reduced financial risk.
The Historical-Exchange-Rate-Comparison Excel template is a reflection of the progress in financial analysis tools. It allows users to compare historical exchange rates of different currencies, providing a clear view of how currencies have performed against each other over time.
Global Economy and Currency Analysis: As the global economy continues to grow more interconnected, the importance of sophisticated financial tools becomes more pronounced. The ability to quickly and accurately assess currency trends is essential for making sound financial decisions in a global context. This template offers a way to visualize and analyze these trends, making it easier to understand and respond to global financial movements.
Predictive Analytics and Future Trends: Looking ahead, the future of currency analysis is likely to be heavily reliant on leveraging historical data for predictive analytics. This involves using past currency performance data to model and predict future trends. The Historical-Exchange-Rate-Comparison Excel template serves as an important tool in this regard, providing the foundational data needed for such predictive analysis.
The template not only serves as a useful tool for current analysis but also as a building block for future advancements in currency market prediction and financial strategy formulation. Its role in modern financial analysis underscores the importance of historical data in understanding and anticipating market movements, a key to successful financial planning and strategy in today’s global economy.
You can download the Excel template by pressing the button below.