Calculating the median in Excel is important for several reasons, particularly when analyzing data sets. The median, being the middle value in a sorted list of numbers, offers a significant advantage in understanding the central tendency of data. Unlike the MEAN function, the MEDIAN function is less affected by outliers and skewed data, making it a more reliable measure in cases where data points are unevenly distributed. For instance, in income data where a few high incomes can skew the average, the median provides a more accurate reflection of the typical income. Excel, with its robust computational abilities, simplifies finding the median, especially in large datasets, allowing for quick and efficient data analysis. This functionality is crucial for statisticians, economists, and anyone dealing with data where the central value is more representative than the average. Calculating the median in Excel thus helps in making more informed decisions based on a more accurate understanding of data trends and distributions. In this guide, we’re going to show you how to use the Excel MEDIAN function and also go over some tips and error handling methods.
Understanding the Basics of Median Calculation
Let's consider a dataset of weekly sales figures to understand the median calculation from a mathematical perspective. The sales figures, given in dollars, are 200, 300, 400, 500, 600, 700, 800, and 900. The median is a statistical measure that represents the middle value in a sorted list of numbers. In this context, it will help us determine the central sales figure. To calculate the median, the first step is to arrange the data in ascending order, but since our dataset is already sorted, we can proceed directly to the calculation.
In our dataset of eight numbers, the median will be the average of the 4th and 5th values, as there is an even number of data points. To find this, we locate the 4th value (500) and the 5th value (600) in the ordered list. The median is then calculated by taking the mean of these two numbers. The calculation is (500+600)/2=. Therefore, the median sales figure, or the central value of our dataset, is $550.
Now, let's modify our dataset to include an outlier. Suppose in a particular week, the sales figure was an unusually high $5000, replacing the original $500 in our list. Our new dataset is 200, 300, 400, 5000, 600, 700, 800, 900. After rearranging in ascending order, the list becomes 200, 300, 400, 600, 700, 800, 900, 5000. The median is again calculated by averaging the 4th and 5th numbers, which are now 600 and 700. The new median is (600+700)/2=. Despite the presence of a significant outlier, the median shifts only slightly from $550 to $650, demonstrating its robustness against extreme values in a dataset.
Supported Excel versions
The MEDIAN function is a basic statistical function that has been supported in Microsoft Excel for many versions, spanning back to earlier editions.
MEDIAN Excel Function Syntax
Arguments
| number1 | The first number or numbers you want to calculate. You can enter a static value like 4, a cell reference like B6, or a cell range like B2:B8. |
| [number2] | Optional. The second number(s) you want to include in the calculation - up to 255 values. |
Examples
The first step in calculating MEDIAN is to ensure that your data is properly entered into the Excel workbook. You can input your numerical data in a row or column; the choice depends on your data organization and preference. For instance, if you're working with a series of values like 15, 25, 35, 45, and 55, you would input these numbers into sequential cells, such as A1, A2, A3, A4, and A5. It's important to note that the MEDIAN function can handle both direct numerical inputs and references to cells containing the numbers, and it will automatically ignore text, logical values, or empty cells within the specified range.
Once your data is in place, the next step is to use the MEDIAN function to find the median value. Click on the cell where you want the result to be displayed. Then, type the formula =MEDIAN(number1, [number2], ...), where number1, number2, etc., are the cells or range of cells containing your data. For the above example, you would input =MEDIAN(A1:A5) in the formula bar. After hitting Enter, Excel will calculate and display the median of your dataset. If the number of data points is odd, Excel will show the middle number. However, for an even number of data points, Excel finds the median by averaging the two central numbers.
Now let's delve into some specific examples of using MEDIAN function.
Example 1: Calculating MEDIAN for Odd Number of Values
The Excel MEDIAN function requires only the selection of the numbers or their references to calculate the median. You can input data in various forms: as static numbers directly in the formula, as named ranges that point to specific data sets, as individual cell references, or as range references encompassing multiple cells. In the provided example, the function targets the range C19:C23, which includes five distinct numbers. This flexibility in data sourcing makes the MEDIAN function a versatile tool, accommodating different data organization styles and requirements, whether the data is spread across various cells or grouped together.
When it comes to the actual calculation, the MEDIAN function follows a specific mathematical formula to determine the median in a data set. This formula is given by (n + 1) / 2, where is the total number of values in the set. Applying this formula to our example, where n , the function computes the median position as (5+1) / 2, which is the 3rd value in the sorted list. Therefore, in the dataset {78, 78, 84, 85, 100}, the MEDIAN function identifies the 3rd value as the median, which in this case is 84. This example clearly demonstrates how Excel's MEDIAN function methodically identifies the central value in a given range, providing a crucial statistical measure for data analysis.

Example 2: Calculating MEDIAN for Even Number of Values
Calculating the median in Excel for a dataset with an even number of values involves a slightly different approach compared to a dataset with an odd number of values. In an even-numbered dataset, the median is determined by finding the average of the two middle numbers. For instance, in our example, the range C19:C23 is used, which comprises five distinct numbers. This versatility in data input means that the MEDIAN function can adapt to various data configurations, making it a highly practical tool for a wide array of Excel tasks, from basic data analysis to more complex statistical evaluations.
According to the formula for calculating the median in an even-numbered set, the position of the median is determined by the expression (6 + 1) / 2, which equals 3.5. This indicates that the median lies between the 3rd and 4th smallest values in the range. Therefore, to find the median of a dataset like {78, 78, 84, 85, 100, 109}, Excel calculates the average of the 3rd (84) and 4th (85) numbers. Consequently, the median for this dataset would be (84 + 85) / 2 = . This method ensures accuracy in the median calculation, especially in datasets where the number of values is evenly distributed.

Comparing MEAN and MEDIAN Calculations in Large Data Sets
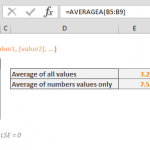
When comparing the MEAN and MEDIAN in large datasets, it's important to understand their distinct characteristics and implications. The MEAN, or average, is calculated by summing all values and dividing by the number of data points. It offers a general overview of the dataset but is highly sensitive to outliers and extreme values. This sensitivity means that in large datasets, a few atypical high or low values can significantly skew the mean, potentially leading to a misleading representation of the data's central tendency. In contrast, the MEDIAN, which is the middle value in an ordered dataset, provides a measure less influenced by outliers. It effectively bisects the dataset into two equal parts and remains stable even in the presence of extreme values. This makes the median a more reliable indicator of the 'typical' value in skewed distributions or when dealing with outliers.
The discrepancy between these two measures can reveal a lot about the data's distribution. In a perfectly symmetrical dataset, the mean and median will converge to the same value. However, large datasets often exhibit skewness, reflected in the divergence of these two measures. If the mean is significantly higher than the median, it suggests a right-skewed distribution, indicating the presence of high-value outliers. Conversely, a mean lower than the median points to a left-skewed distribution, hinting at low-value outliers. This difference is particularly insightful in fields such as economics or social science, where understanding the distribution of values like income or population attributes is crucial.
In practice, calculating both the mean and median in large datasets offers a more comprehensive view of the data. While the mean provides an arithmetic average, the median gives a central point that is robust against skewness, offering complementary insights. Visual tools like histograms and box plots can further aid in understanding these differences. These plots visually compare the positions of the mean and median, highlighting any asymmetry and outliers. This dual analysis approach is essential in fields like data science, economics, and research, where nuanced understanding of data distributions informs decision-making and policy development. Such a comparison not only helps in identifying the nature of the data but also guides the appropriate statistical methods for analysis and interpretation.
Common Errors in Calculating MEDIAN in Excel
When calculating the median in Excel, encountering errors and issues that require troubleshooting is not uncommon. A typical error that users often face is the #DIV/0! error. This error occurs when there is an attempt to divide by zero, which is mathematically undefined, or when the formula references an empty cell. For example, if your median formula accidentally includes a cell range where cells are blank or contain non-numeric data, Excel might interpret this as dividing by zero, leading to the #DIV/0! error. Similarly, the #VALUE! error is another frequent issue, which arises when Excel encounters a problem with the values in your formula. This can happen if the formula includes non-numeric characters, such as text in a range meant for numerical values, or if there's a syntax error in how the formula is written. Both errors can significantly disrupt the median calculation process and yield incorrect results.
To effectively troubleshoot these errors, a systematic check of your data, formulas, and syntax is essential. Start by examining the range of cells included in your median calculation. Ensure that all cells contain valid numerical data and that there are no empty cells mistakenly included in the range. Additionally, review the syntax of your median formula for any typographical errors or incorrect cell references. It's also important to ensure that the data being used is appropriate for median calculation and not better suited for other statistical methods. Paying close attention to these details can help you quickly identify and rectify the source of the #DIV/0! or #VALUE! errors, ensuring accurate and reliable median calculations in Excel.
Some Tips in Using MEDIAN Function
Using the MEDIAN function in Excel can greatly enhance your data analysis, but there are key tips to keep in mind for optimal results.
Accurate Data Selection: Ensure that the range of cells selected for the MEDIAN function accurately represents the data you want to analyze. Inaccurate range selection can lead to skewed results. For instance, if you're calculating the median salary in a dataset, make sure to include all relevant salary cells and exclude non-numeric or irrelevant ones.
Handling Blank and Non-Numeric Cells: Be aware that the MEDIAN function automatically ignores blank and text cells in the range. While this is often helpful, it's important to check your data for unintentional blank or non-numeric cells that might affect the accuracy of your median calculation.
No Need for Pre-Sorting: Unlike some other statistical calculations, you don’t need to sort your data before using the MEDIAN function. Excel will internally manage the sorting as part of the function, saving you a step and reducing the chance of errors.
Combining with Other Functions: For more sophisticated analysis, you can combine the MEDIAN function with other Excel functions. For instance, using MEDIAN within an IF statement allows you to calculate the median for specific conditions or subsets of your data, adding a layer of customization to your analysis.
Dynamic Data Range: If you are working with a dataset that is regularly updated, consider using a dynamic named range for your MEDIAN function. This way, the range will automatically adjust as new data is added, ensuring that your median calculation is always up-to-date and includes all relevant data points.