In today's data-centric environment, the ability to efficiently search and filter through extensive datasets is essential for informed decision-making. Excel, a predominant tool in data analysis, offers comprehensive functionalities that enhance user experience and improve the accuracy and speed of data retrieval. These advanced capabilities enable users to pinpoint specific data points within large datasets, thereby minimizing time spent navigating through numerous rows and columns and boosting overall productivity. By isolating relevant data, users can perform more targeted and precise analyses, especially when managing complex datasets. Moreover, employing search and filter features mitigates the risk of errors inherent in manual data sorting and extraction, ensuring reliable outcomes.
Excel's customizable search and filter options provide a flexible and tailored approach to data analysis, and can be integrated with other tools, such as SpreadsheetWeb. This integration facilitates the creation of interactive web applications, further enhancing data usability and accessibility. The following sections will delve into the setup and implementation of search and filter functionalities in Excel, their integration with SpreadsheetWeb, and strategies to augment their performance and precision, enabling the transformation of raw data into actionable insights.
Search Functionality
Excel's search capabilities empower users to locate specific data points within extensive datasets. This capability reduces the time and effort spent on manual data navigation, allowing users to identify relevant information. By leveraging Excel's robust search capabilities, data retrieval becomes both faster and more precise, enhancing the accuracy of the analytical process. Whether dealing with financial records, customer databases, or various other data types, the search functionality streamlines workflows and boosts overall productivity, ensuring that essential information is always within easy reach.
Setting Up Search Parameters
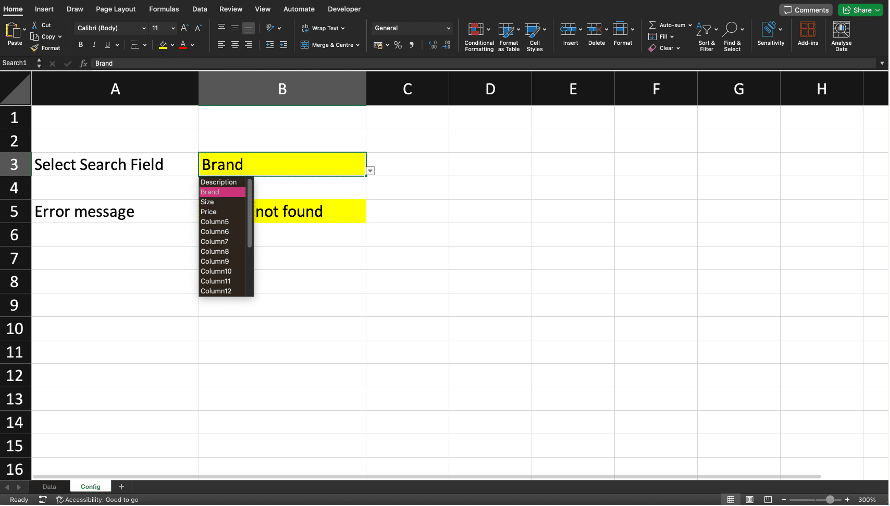
Setting up search parameters in Excel involves defining the criteria that the search function will use to locate specific data points. This step is crucial for ensuring that the search results are relevant and accurate. Users can set up search parameters by specifying the range of cells to search, the type of data to look for, and any specific conditions or criteria that must be met. For instance, you can search for text, numbers, dates, or even specific patterns within your dataset.
Implementing Search Using Formulas in Excel
Implementing search features using formulas in Excel allows for more advanced and customized search capabilities. Formulas such as VLOOKUP, HLOOKUP, INDEX, and MATCH can be used to create powerful search functions that go beyond the basic search tools provided by Excel.
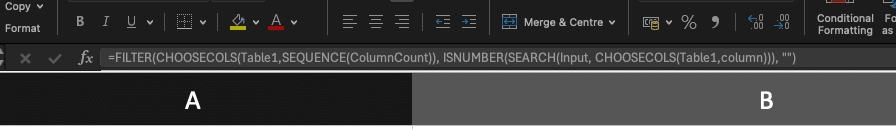
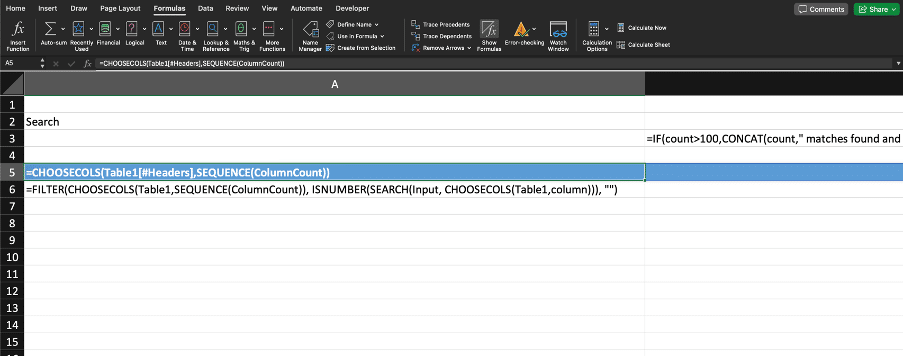
For example, FILTER function can be used to search for a value in the first column of a data table and return specific columns in the data for all matching rows. By combining these formulas, users can create dynamic search functions that can handle complex datasets and return precise results. Implementing search features with formulas enhances the flexibility and power of Excel's search capabilities.

Integrating Search in SpreadsheetWeb
Integrating search functionality in SpreadsheetWeb extends the power of Excel's search tools to web applications. SpreadsheetWeb allows users to convert Excel spreadsheets into interactive web applications, making it easier to share and access data online. By integrating search features into these web applications, users can enable real-time data retrieval and analysis for a broader audience.
Converting an Excel File into a Web Application for Search Applications
Secure Data Access: One of the significant advantages of converting an Excel file into a web application is the ability to secure the underlying data. Users can view search results without accessing the entire dataset. This security measure ensures that information remains protected while still providing valuable insights through search queries.
Familiar Data Management: Updating data within a SpreadsheetWeb application is straightforward and user-friendly. Users can continue to manage and update their data in the familiar Excel interface. Once changes are made, the updated spreadsheet can be republished to SpreadsheetWeb, ensuring the web application always reflects the most current data.
By converting Excel files into web applications with integrated search functionality, SpreadsheetWeb enables users to secure their data, update it easily, and provide search capabilities to a broader audience. This integration not only enhances data accessibility but also improves the overall efficiency of data management and retrieval.

Filter Functionality
Filter functionality in Excel allows users to selectively display only the data that meets specific criteria, hiding the rest. This is particularly useful when working with large datasets, as it enables users to focus on the most relevant information without being overwhelmed by extraneous data. Filtering can be applied to columns to show only rows that meet certain conditions, such as specific values, ranges, or text patterns. By using filters, users can quickly narrow down their data to make it more manageable and easier to analyze.
Defining Filter Criteria
Defining filter criteria involves specifying the conditions that data must meet to be displayed. In Excel, this can be done using two main methods: the user interface (UI) based filter feature and formula-based filtering.
UI-Based Filtering
Excel’s UI-based filter feature, available through the Data tab, provides a straightforward way to filter data. This feature allows users to set criteria based on various factors, such as numerical ranges, specific text, dates, or custom formulas. For instance, you might filter a sales report to show only transactions above a certain amount or filter a list of customer reviews to display only those with a particular keyword.

Formula-Based Filtering
In addition to the UI-based filters, Excel allows for more advanced filtering using formulas. Formula-based filtering provides greater flexibility and control over the data being displayed. This method is particularly useful when dealing with complex criteria or when you need to automate the filtering process.
Example of Formula-Based Filtering:
To filter data using formulas, you can utilize functions such as FILTER, IF, CHOOSECOLS, or CHOOSEROWS. Here’s a simple example using the FILTER function:
=FILTER(A1:C10, B1:B10 > 1000, "No results")
This formula filters the range A1:C10 to display only the rows where the values in column B are greater than 1000. If no results meet the criteria, it returns "No results."
By focusing on formula-based filtering, you can achieve more dynamic and complex data manipulation, which can be crucial for detailed analysis and reporting.
Clearly defined filter criteria, whether set through Excel’s UI-based filter feature or using formulas, ensure that the filtered data is relevant and useful for the analysis or task at hand. While the UI-based filter is easy and quick to use, formula-based filtering offers advanced capabilities for more sophisticated data handling needs. In this article, we will focus on the latter, providing you with powerful tools to enhance your data analysis in Excel.
Adding Filtering Options to SpreadsheetWeb
Using filtering through SpreadsheetWeb extends Excel's powerful filtering capabilities to web applications. When an Excel spreadsheet with filter formulas is published to SpreadsheetWeb, these formulas become interactive for end-users accessing the web application. This integration allows users to manipulate data directly on the web without needing Excel installed on their device.
One of the key advantages of using web application filters over exposing the Excel file lies in secure data access. In a web application, users can view and interact with filtered data without accessing the entire dataset, ensuring that information remains protected. In contrast, exposing the entire Excel file can lead to unauthorized access to confidential data, posing a significant security risk. Enhanced usability is also a major benefit. Users can easily manipulate data through a web interface, making it accessible on any device with an internet connection. This is in stark contrast to requiring users to have Excel installed on their device, which limits accessibility and flexibility.
Furthermore, familiar data management is a significant advantage. Admins can update the data in the familiar Excel interface. Once changes are made, the updated spreadsheet can be republished to SpreadsheetWeb, ensuring the web application always reflects the most current data. This process eliminates the need to manually distribute changes, reducing the risk of version control issues and ensuring consistency across all users.
Display Options
Effective data display is a critical component of data analysis and reporting. Excel, combined with SpreadsheetWeb, offers a variety of options for presenting data, ranging from simple tables to sophisticated charts and maps. Selecting the appropriate display method hinges on the nature of the data and the insights you aim to convey. SpreadsheetWeb extends Excel's capabilities by enabling the creation of interactive web applications, making data more accessible and engaging for a wider audience. By harnessing the combined strengths of Excel and SpreadsheetWeb, users can produce dynamic and interactive reports that deliver deep insights and promote better communication.
Simple Tabular Display
A simple tabular display in Excel involves organizing data into rows and columns, making it easy to read and interpret. Tables are ideal for presenting structured data such as financial records, inventory lists, and survey responses. Excel tables come with built-in features such as sorting, filtering, and formatting options that enhance data readability and manipulation. By converting data ranges into tables, users can leverage these features to maintain a clean and organized dataset.

Integrating Tables in SpreadsheetWeb
Integrating tables in SpreadsheetWeb utilizes the structured data presentation capabilities of Excel to create dynamic, web-based applications. The Output Grid Control is central to this integration, allowing for data display based on Excel calculations and retaining all formatting. Users can employ Excel formulas for complex data manipulation before display. Features include dynamic data display, pagination for large datasets, and export options to formats like Excel or PDF. Users prepare their data in Excel, upload to SpreadsheetWeb, configure the Output Grid, and deploy their web application to share interactive tables effectively.

Data Visualization: Charts
Charts are powerful tools for data visualization, helping to display complex data through visual representations. Excel offers a variety of chart types, including bar charts, line charts, pie charts, and more, each suitable for different types of data and analysis. Charts can highlight trends, compare data points, and reveal patterns that may not be immediately apparent in tabular data. By selecting the appropriate chart type and customizing it to fit the data, users can create compelling visualizations that enhance data comprehension.

Creating Charts in Excel
Creating charts in Excel is a straightforward process. Users can select the data range they wish to visualize and choose a chart type from the Insert tab. Excel provides customization options such as chart titles, labels, colors, and styles to enhance the visual appeal and clarity of the charts. Advanced features like adding trendlines, secondary axes, and data labels allow for more detailed analysis. By experimenting with different chart types and customization options, users can create effective visual representations of their data.
Integrating Charts in SpreadsheetWeb
Integrating charts in SpreadsheetWeb enables users to share interactive data visualizations online. When charts created in Excel are published to SpreadsheetWeb, they retain their interactive elements, allowing users to explore the data visually on the web. This feature is particularly useful for dashboards and reports that need to be accessible to a broad audience. Users can design and customize their charts in Excel, then publish them to SpreadsheetWeb to create engaging, web-based data visualizations.

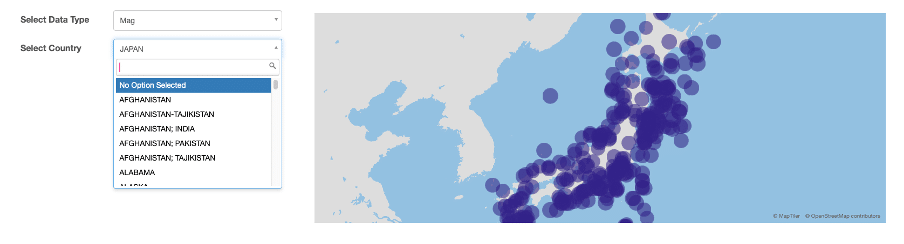
Data Visualization: Maps
Maps are a valuable tool for visualizing geographical data, providing a spatial context to the data analysis. Excel supports map visualizations through features like 3D Maps and filled map charts, allowing users to plot data points and regions on a map. Maps can reveal geographic patterns, trends, and distributions that are not easily visible in other types of charts. They are particularly useful for analyzing data such as sales by region, population distributions, and site locations.
Creating Maps in Excel
Creating maps in Excel involves using the 3D Maps feature or filled map charts available in the Insert tab. Users can plot geographical data by specifying locations and values, which Excel then visualizes on a map. Customization options allow users to adjust the map's appearance, such as changing colors, adding data labels, and adjusting map views. By utilizing these features, users can create informative and visually appealing map visualizations that highlight geographic data insights.

Integrating Maps in SpreadsheetWeb
Integrating maps in SpreadsheetWeb allows users to share interactive geographic data visualizations online. When geographic data created in Excel are published to SpreadsheetWeb, it enables web users to explore geographic data in detail. This capability is beneficial for applications such as location-based analysis, regional reporting, and spatial data presentations. Users can configure their geographic data in Excel, and then publish them to SpreadsheetWeb to create interactive, web-based map visualizations.
Moreover, SpreadsheetWeb includes more advanced mapping capabilities than what’s available in Excel. These enhanced features provide users with a wider array of map types, each offering unique functionalities and visualization options:
- Cartogram Maps
- Continuous Cartogram Maps
- Standard Maps
- Tile Maps
- Density Maps
- Route Maps
By leveraging these advanced mapping capabilities, users can create more sophisticated and informative geographic data visualizations, enhancing their web-based reports and dashboards with SpreadsheetWeb.
Adding Location-Specific Data and Images
Adding location-specific data and images to maps enhances the depth and context of geographic visualizations. In SpreadsheetWeb, users can annotate maps with additional data points, images, and information relevant to specific locations. This could include photos of sites, descriptions, and other relevant data that provide more context and detail. By enriching maps with location-specific data and images, users can create more informative and engaging visualizations that offer deeper insights into the geographic aspects of their data.

Publishing and Sharing Your Web Application
Creating a web application from an Excel workbook and sharing it online extends the reach and impact of your data analysis and visualizations. SpreadsheetWeb allows you to convert Excel spreadsheets into interactive web applications, making your data accessible to a wider audience through a web browser. This process involves updating your data in Excel, publishing it to SpreadsheetWeb, and sharing the interactive web application online.
Updating Your Data in Excel
The first step in publishing a web application is ensuring that your data in Excel is up-to-date and accurate. Regularly updating your data ensures that the insights and visualizations you share are relevant and reliable. Make any necessary adjustments to your data, formulas, and visualizations within the Excel workbook. This includes refreshing data connections, recalculating formulas, and updating charts, tables, and maps to reflect the latest information.
Publishing with SpreadsheetWeb
Once your data is updated in Excel, you can publish it to SpreadsheetWeb. SpreadsheetWeb provides a user-friendly interface for updating Excel workbooks.
Sharing Your Interactive Web Application Online
If you are updating the Excel data for an existing SpreadsheetWeb application, the application link will remain the same after republishing. This ensures that data updates are completely transparent to the end users. There will be no need to resend them a file or updated link; they can continue using the same link to access your search or filter application. By following these steps, you can effectively update, publish, and share your Excel-based web applications, leveraging the power of SpreadsheetWeb to transform static spreadsheets into dynamic, interactive web tools.