This article will illustrate how to create an interactive mapping application with search using SpreadsheetWeb. It showcases the benefits of viewing and consuming a sample data of worldwide earthquakes on any screen size, making it accessible to everyone.
There are several reasons why we ought to be able to view earthquake data. First of all, this makes it possible for researchers and scientists to understand earthquake patterns and trends, leading to greater understanding of seismic activities. Second, the information it delivers is handy to the public, helping communities understand natural hazards. Finally, this tool serves educational purposes, helping students or enthusiasts learn about earthquakes and their effects in a dynamic way. This article focuses on creating an earthquake search app, but remember, these skills can be applied to many other types of data. For example, similar applications can be created to render data on weather patterns, traffic incidents, environmental monitoring, and public health statistics. By utilizing it, you can turn static data into interactive web applications that not only clarify information but also draw users in impactful ways.
Getting Started
To get started on your interactive earthquake search application, you'll need access to SpreadsheetWeb. If this is your first time using it, head over to their website and sign up for an account. It's also important that you have a good understanding of Excel, as this will be the foundation of your application.
Creating the Excel Spreadsheet
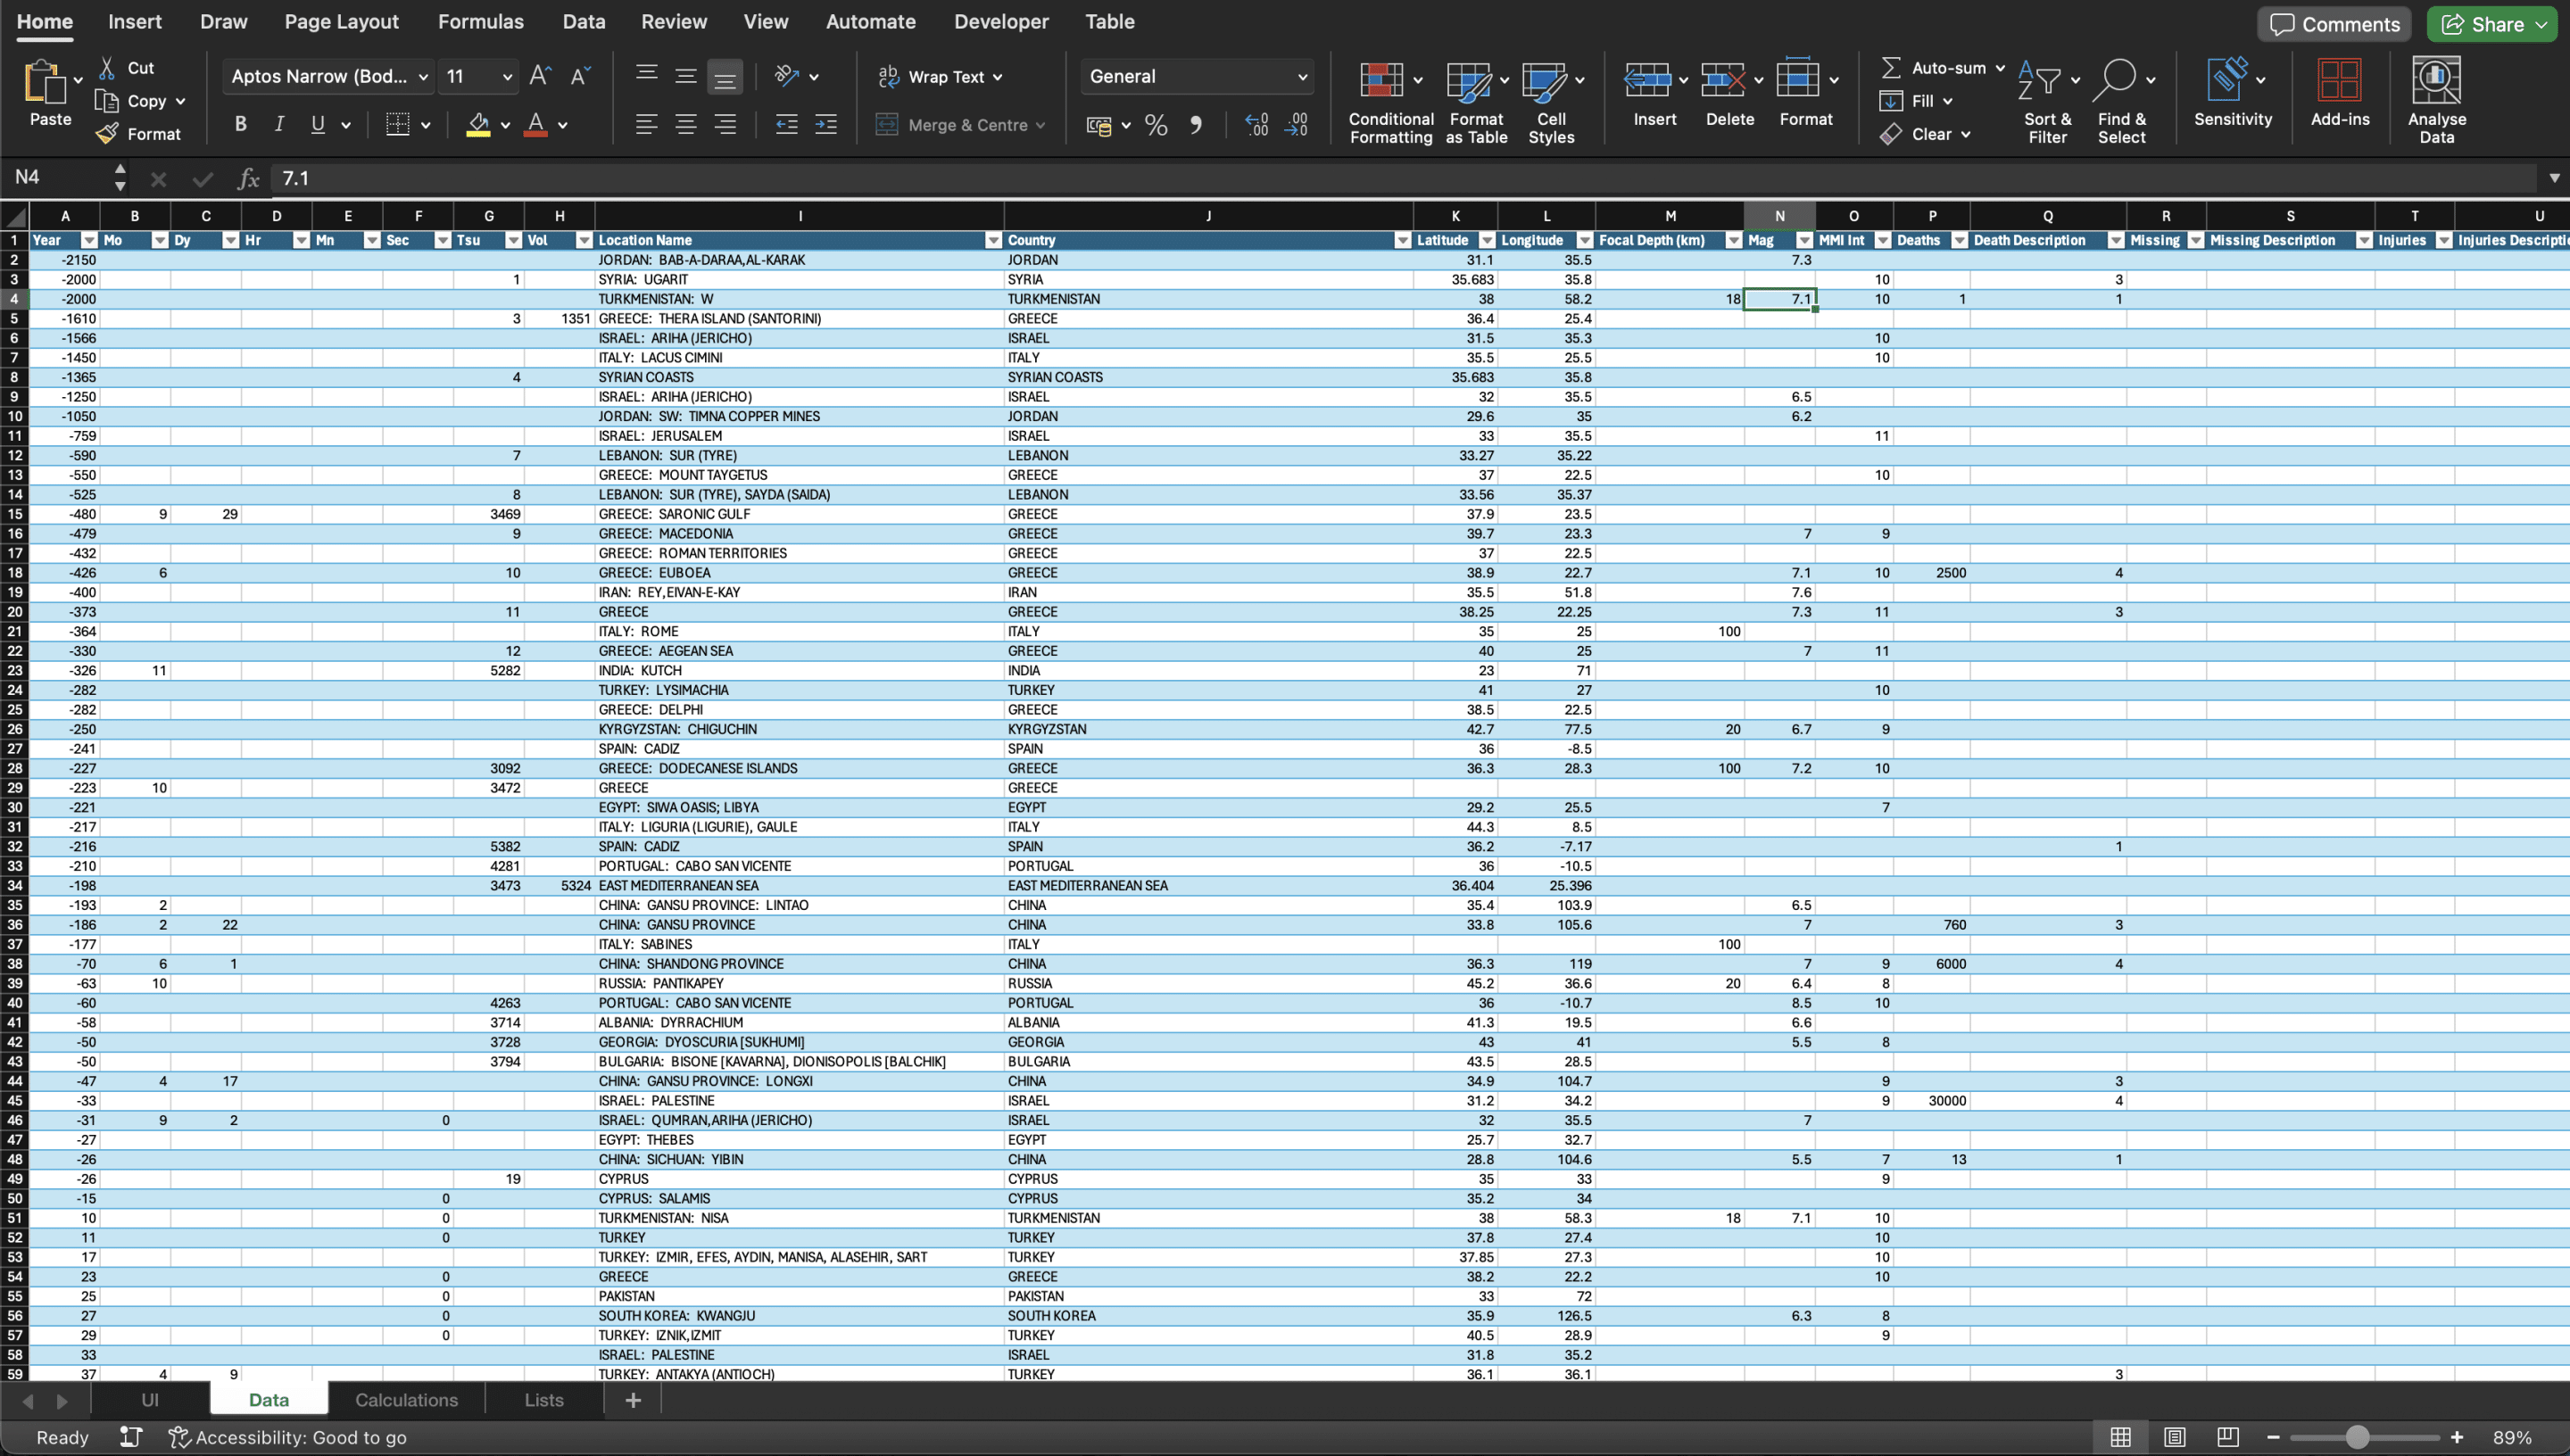
Creating a well-structured Excel spreadsheet is the key to success for your application. Start by designing a clear and organized layout. This will make data entry and analysis much simpler. Begin by inputting the earthquake data you've prepared into the spreadsheet. Make sure each column has clear and concise headings like 'Date,' 'Magnitude,' 'Location,' 'Depth,' and any other relevant details. Clear headings not only make your data easier to understand but also enable you to create more effective visualizations and interactions within your application.
Publish the Application
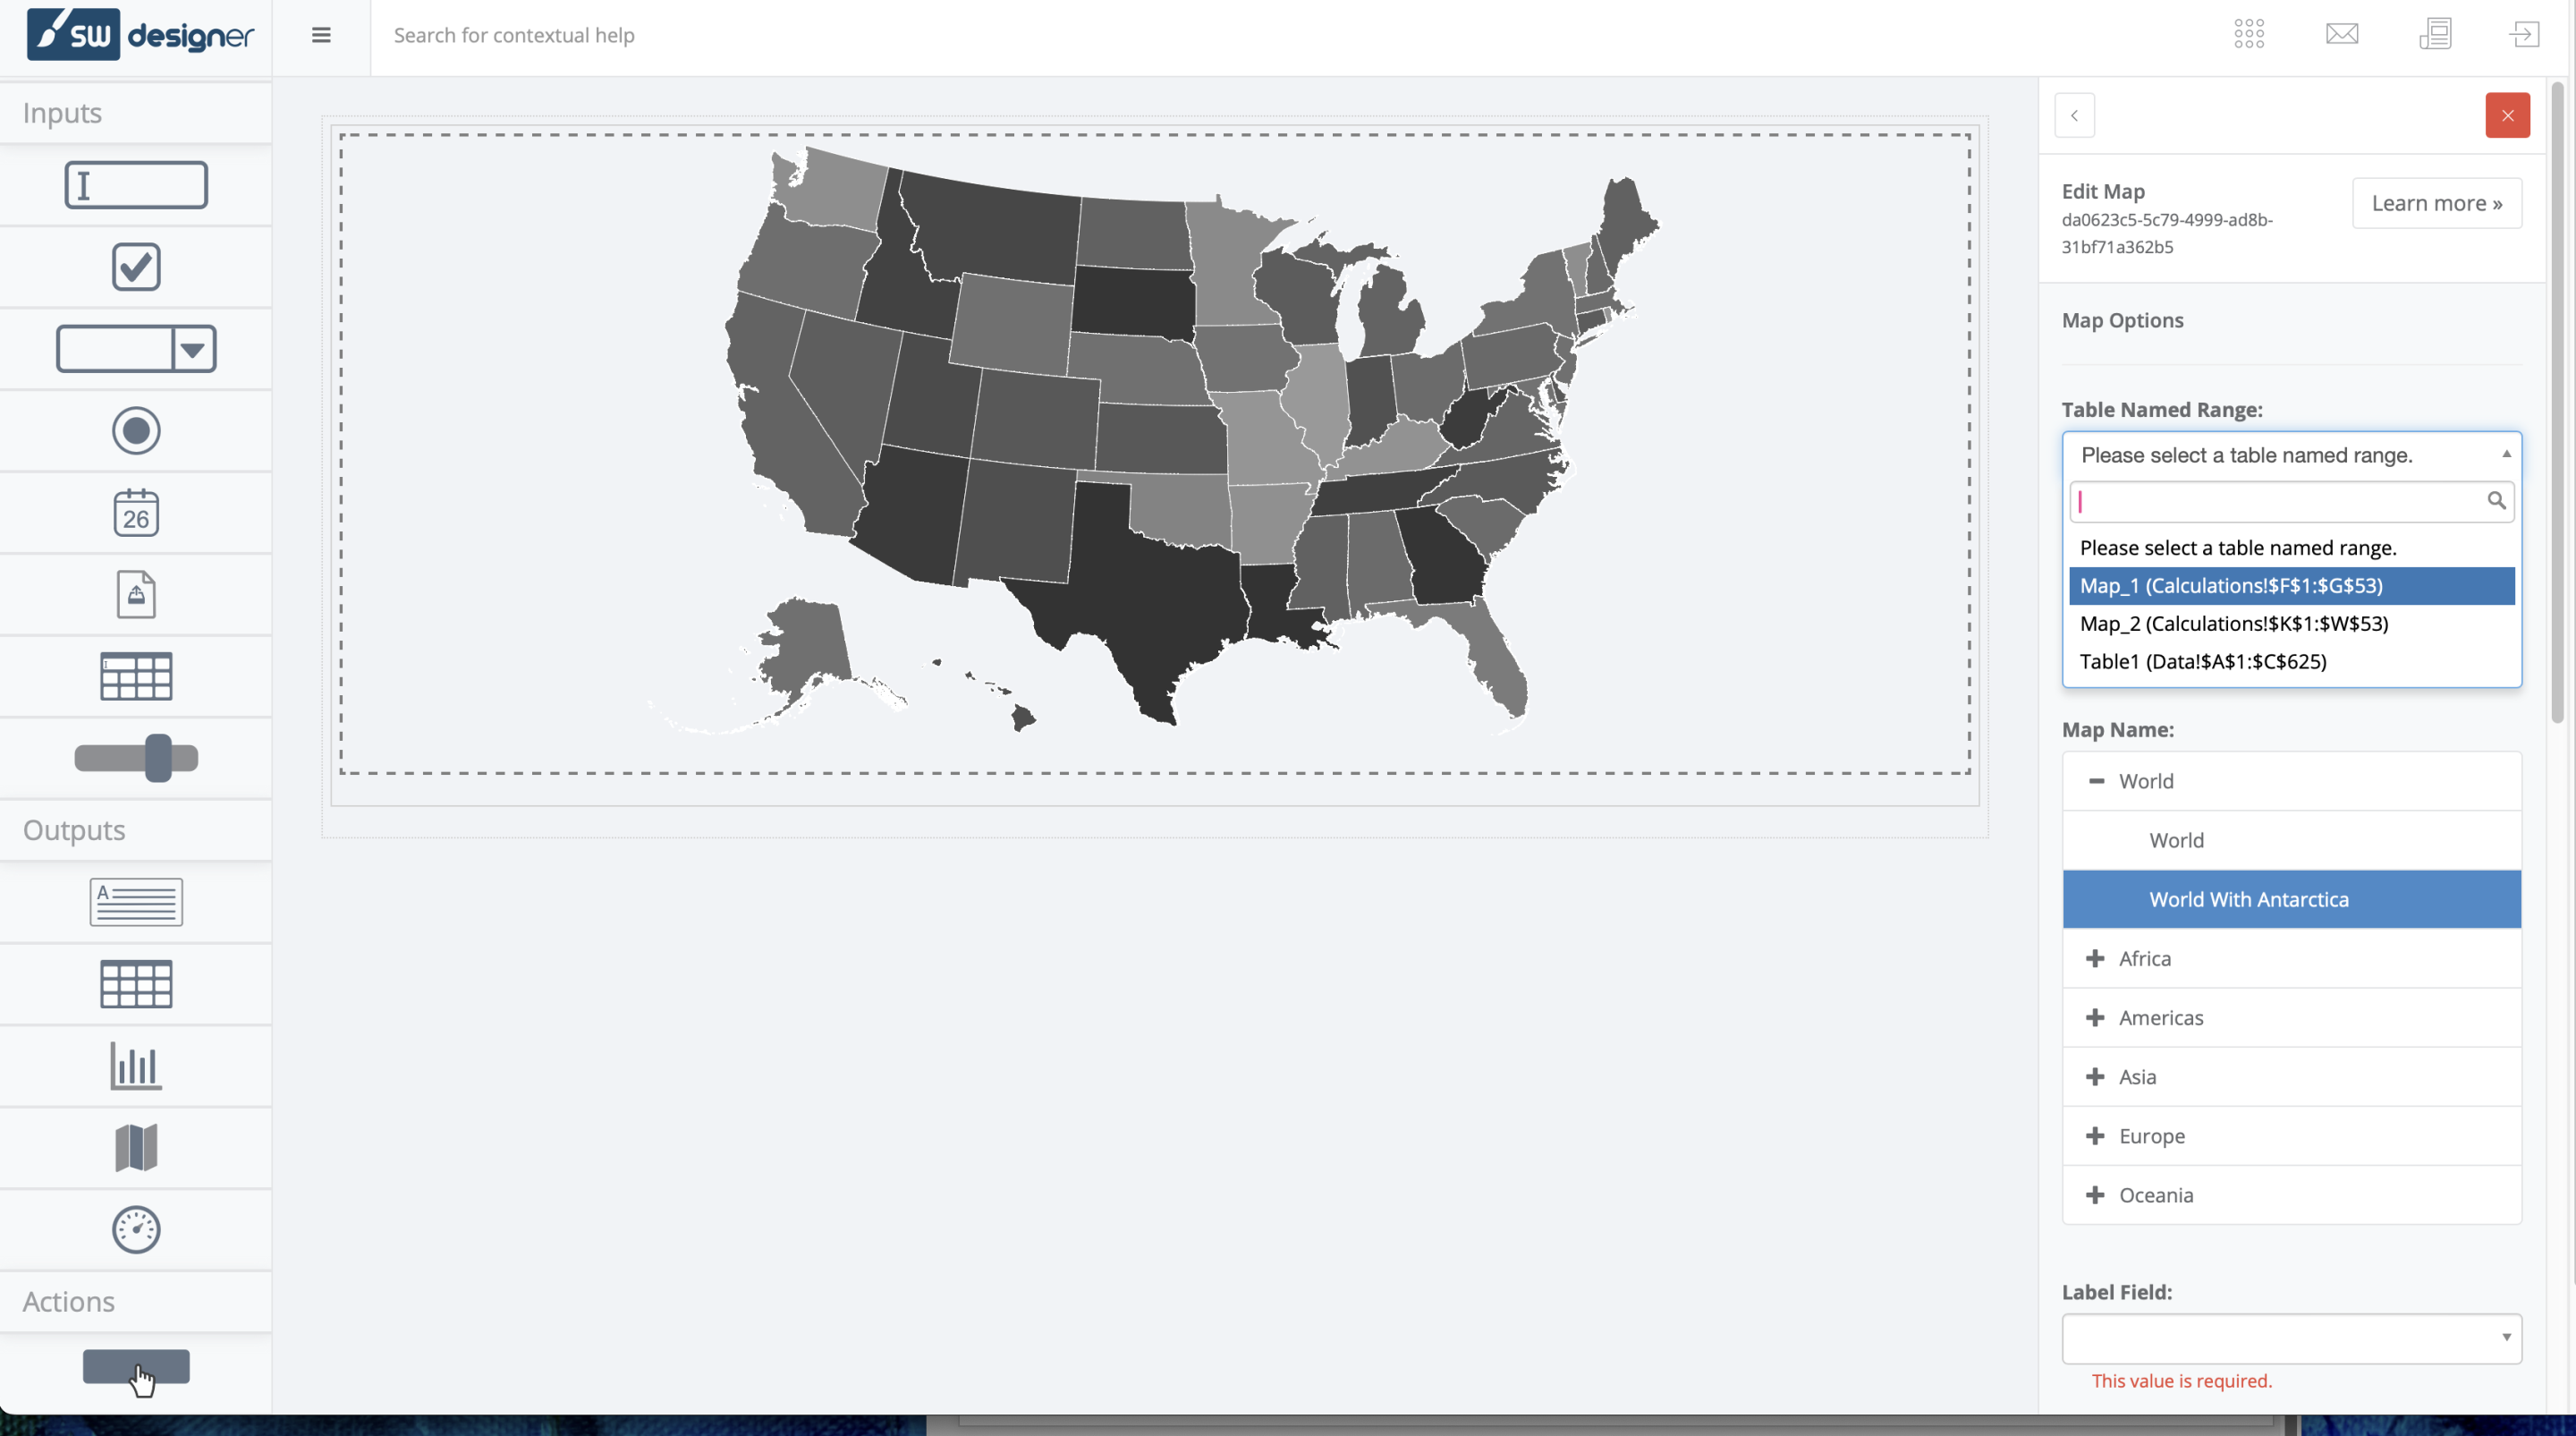
Getting your earthquake application public is simple. Click to the preview first to make sure everything is in place, and then click the publish button. Your application will be available to use.
Click here to see the application we have built.

In this article, we covered the end-to-end steps of building an earthquake search application starting from data preparation to deploying the final product. We went over the most significant steps of mapping to Excel charts and graphs, integrating with SpreadsheetWeb, and adding interactive functionalities to boot. We have created each of these stages to enable the application to be laid down, functional, and also to be user-friendly to provide insights into earthquake data.
If you want to take your app a step further, you can explore other features of SpreadsheetWeb, like data manipulation and integrations with third-party services. These are very powerful features that enable you to create richer applications with more functionality and flexibility. SpreadsheetWeb is full of possibilities to create strong and dynamic applications of all kinds that cater to many different use cases and industries.
If you created an earthquake app on top of your map app, you now know many of the general skills and knowledge that you need to extend existing capabilities and build more powerful tools. The methods and learnings from this practice will help you whether you opt to improve your existing applications or write new ones. Take SpreadsheetWeb and its opportunities and keep innovating not just by enhancing your visualization and data interaction but also with new responsive application design skills.